OPEN-SOURCE SCRIPT
Telah dikemas kini MACD Area
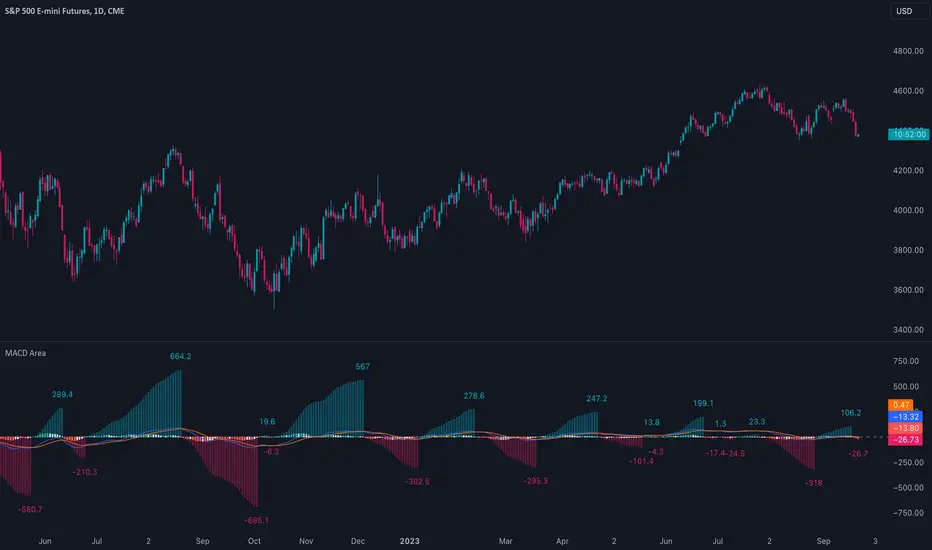
This indicator calculates and displays the cumulative area for each region above and below the zero line in the MACD histogram. This area measurement serves as a momentum metric, where larger cumulative areas indicate stronger momentum. Divergences between the area and price can also potentially indicate an impending reversal. For example, when the stock price makes a higher high but the area makes a lower high, the current momentum may be unsustainable.
Nota Keluaran
Added support for displaying area values via labels.Skrip sumber terbuka
Dalam semangat TradingView sebenar, pencipta skrip ini telah menjadikannya sumber terbuka, jadi pedagang boleh menilai dan mengesahkan kefungsiannya. Terima kasih kepada penulis! Walaupuan anda boleh menggunakan secara percuma, ingat bahawa penerbitan semula kod ini tertakluk kepada Peraturan Dalaman.
专业缠论指标: alphaviz.pro/chanlun
Email: contact@alphaviz.pro
Discord: discord.gg/w2fFtNega4
Email: contact@alphaviz.pro
Discord: discord.gg/w2fFtNega4
Penafian
Maklumat dan penerbitan adalah tidak bertujuan, dan tidak membentuk, nasihat atau cadangan kewangan, pelaburan, dagangan atau jenis lain yang diberikan atau disahkan oleh TradingView. Baca lebih dalam Terma Penggunaan.
Skrip sumber terbuka
Dalam semangat TradingView sebenar, pencipta skrip ini telah menjadikannya sumber terbuka, jadi pedagang boleh menilai dan mengesahkan kefungsiannya. Terima kasih kepada penulis! Walaupuan anda boleh menggunakan secara percuma, ingat bahawa penerbitan semula kod ini tertakluk kepada Peraturan Dalaman.
专业缠论指标: alphaviz.pro/chanlun
Email: contact@alphaviz.pro
Discord: discord.gg/w2fFtNega4
Email: contact@alphaviz.pro
Discord: discord.gg/w2fFtNega4
Penafian
Maklumat dan penerbitan adalah tidak bertujuan, dan tidak membentuk, nasihat atau cadangan kewangan, pelaburan, dagangan atau jenis lain yang diberikan atau disahkan oleh TradingView. Baca lebih dalam Terma Penggunaan.