OPEN-SOURCE SCRIPT
Moving Averages Trend Indicator
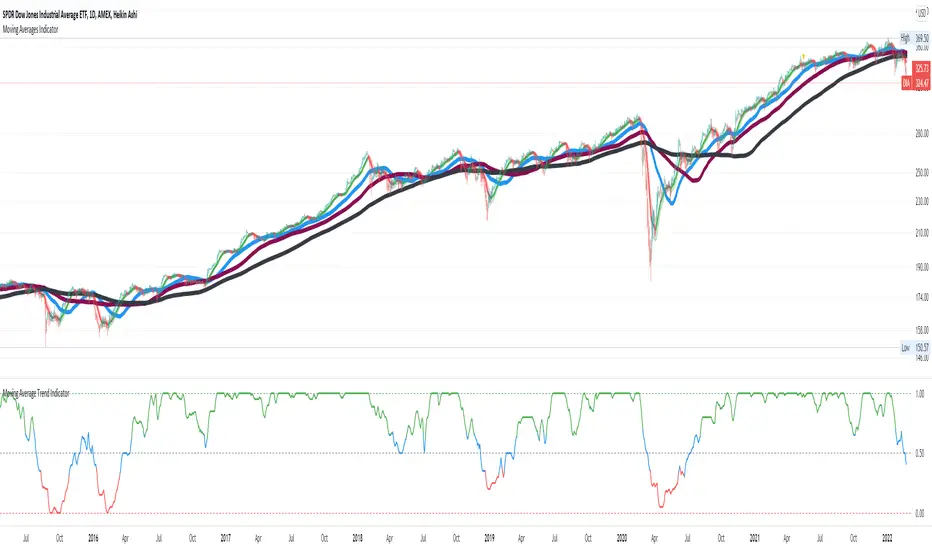
Computes a metric (0.0-1.0) based on the relative (above/below) relationship of price (close) and the moving averages of WMA0 (20day), SMA1 (50day), SMA2 (100day), SMA3 (200day).
Metric = 1.0 when price > SMA0 > SMA1 > SMA2 > SMA3
Metric = 0.0 when price < SMA0 < SMA1 < SMA2 < SMA3
This metric helps you track the price "trend." Color of the metric helps you track if the price is a bullish (green) or bearish (red). Blue indicates neutral.
Settings:
- Time Frame is adjustable
- SMA lengths are adjustable
- Threshold for bullish/bearish is adjustable
Skrip sumber terbuka
Dalam semangat TradingView sebenar, pencipta skrip ini telah menjadikannya sumber terbuka, jadi pedagang boleh menilai dan mengesahkan kefungsiannya. Terima kasih kepada penulis! Walaupuan anda boleh menggunakan secara percuma, ingat bahawa penerbitan semula kod ini tertakluk kepada Peraturan Dalaman.
Penafian
Maklumat dan penerbitan adalah tidak bertujuan, dan tidak membentuk, nasihat atau cadangan kewangan, pelaburan, dagangan atau jenis lain yang diberikan atau disahkan oleh TradingView. Baca lebih dalam Terma Penggunaan.