PROTECTED SOURCE SCRIPT
Telah dikemas kini Manual Trend Line [SDAlgo]
There is a a saying "Necessity is the Father of Invention."
Truly speaking, this indicator also took birth from the same necessity when using TradingView's built-in drawing tool was unable to do what I was looking for. It's "Trend Line". What this built-in drawing tool lacks:
1. It cannot be extended to the current bar.
2. It doesn't provide the the ability to get the price value of the Trend Line at the current bar when extended.
3. It can only be a line but not a channel kind of thing.
So, this manual Trend Line overcome all those mentioned above but being simple without much intricacies or complex calculations.
How does this indicator works:
The following screenshot appears when user first select this Indicator to apply on your chart, it asks user to choose the start time point of of the Trend Line (instead of Point in drawing tool). The default setting is Resistance Trend Line, so user may opt for the time point where the user finds a suitable high. However, as there is multiple confirmation in different stages, user may also opt for time point where the user intend to place the support line start.:
https://photos.google.com/share/AF1QipMrZk304KJPp7FNMWxmzRvrnYRMPrfFNFL60IOShGVH7yFHQVDOObPchBZe-lbW6A/photo/AF1QipNoZTob0Q5cjHiUOlWR4tr0z8MVwBEoGyTDAznN?key=bjNlMFhfbV93ZTd5aDN3ZTVRTEwxMjU4LXdZMTVn
Once user choose the start time point, it will ask the end time point as per the below screenshot:
https://photos.google.com/share/AF1QipMrZk304KJPp7FNMWxmzRvrnYRMPrfFNFL60IOShGVH7yFHQVDOObPchBZe-lbW6A/photo/AF1QipM_fo00CYaIMeSPBEg0vCmu1p1_SfUREpUhoLDt?key=bjNlMFhfbV93ZTd5aDN3ZTVRTEwxMjU4LXdZMTVn
Once the second point is also chosen, then the following screen appears for user to confirm other parameters:
https://photos.google.com/share/AF1QipMrZk304KJPp7FNMWxmzRvrnYRMPrfFNFL60IOShGVH7yFHQVDOObPchBZe-lbW6A/photo/AF1QipOw_58x9DTV67hMXCks8Rqi3XazyakcjfyBpUKC?key=bjNlMFhfbV93ZTd5aDN3ZTVRTEwxMjU4LXdZMTVn
User can choose:
1. Trend Line Type: Resistance or Support
2. Trend Line Touch Points: Either High/Low of the candle (when resistance, it will touch the highs, when support, it will touch the lows for the selected time point candles.) or candle body (in this case, the trendline will touch the high of the candle body when Resistance is selected else it will touch the low of the candle body when Support is selected.)
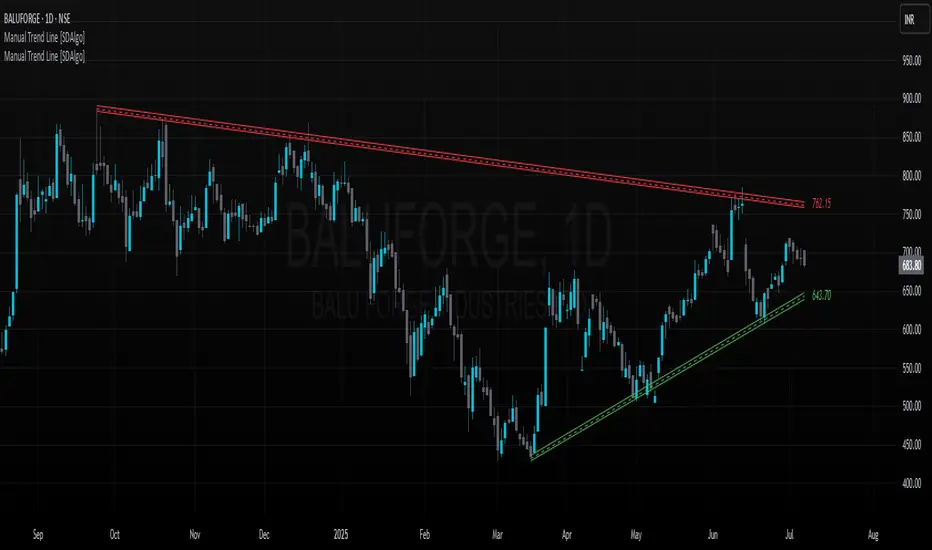
3. Trend Line Visibility: Single Line or Multiple Line. The default screenshot with this publication shows the multiple line where the center dashed line is the touch points and outer solid lines are indicating a narrow zone. This zone is to cover some other high (or low points) which didn't exactly touch the dashed line but the rejection came to very near to it.
Once you click apply, say with other default setting except the time point, the trendline will be visible like the below screenshot:
https://photos.google.com/share/AF1QipMrZk304KJPp7FNMWxmzRvrnYRMPrfFNFL60IOShGVH7yFHQVDOObPchBZe-lbW6A/photo/AF1QipM23aN9_ylW0pzpcbyIIVcogt6Jab1yVJ-RuzSM?key=bjNlMFhfbV93ZTd5aDN3ZTVRTEwxMjU4LXdZMTVn
By default the Trend Line is extended left but it stops at the current running or the last historical bar with a small value mentioned at the right of the Trend Line as the price value of it at the current bar.
Also by default the resistance selection colors the line as Red and Green when selected support.
User can go into the settings and fiddle with it for other settings. If the line visibility is changed to Multiple Line, the Trend Line in the just previous picture will become multiple line as is below:
https://photos.google.com/share/AF1QipMrZk304KJPp7FNMWxmzRvrnYRMPrfFNFL60IOShGVH7yFHQVDOObPchBZe-lbW6A/photo/AF1QipOkxNLtlvJRYwqD5uzXRCoCJa5o9IglFOauv4h8?key=bjNlMFhfbV93ZTd5aDN3ZTVRTEwxMjU4LXdZMTVn
Other parameter are:
1. Line Thickness: For single line type, the thickness can be made from 1 to 10.
2. The label size can be made from 8 to 16 for the Price Value of the Trend Line at current bar.
Draggability:
Unlike Built-in Trendline, this doesn't have the efficiency of dragging the start or endpoints but it has the another ability to drag the start and end time of the Trend Line. In that case, you just select the Trend Line and two vertical lines will appear on your chart on the start and end point of the Trend Line. User can drag the vertical time points to whichever bar user want to place to.
In this way, the semiautomatic "Manual Trend Line" can be drawn on the chart but with some additional features as mentioned earlier.
This Indicator is free for all but I'm hiding the source code for some unforeseen reasons. If Both the Upper Trend Line and Lower Trend Lines are required on a single chart, then the indicator should be added two times on the chart, that's it.
If user faces any issues during placement of the Indicator on the chart, I may be contacted over TradingView direct message and can help the user for any clarifications, overcoming any issues.
Truly speaking, this indicator also took birth from the same necessity when using TradingView's built-in drawing tool was unable to do what I was looking for. It's "Trend Line". What this built-in drawing tool lacks:
1. It cannot be extended to the current bar.
2. It doesn't provide the the ability to get the price value of the Trend Line at the current bar when extended.
3. It can only be a line but not a channel kind of thing.
So, this manual Trend Line overcome all those mentioned above but being simple without much intricacies or complex calculations.
How does this indicator works:
The following screenshot appears when user first select this Indicator to apply on your chart, it asks user to choose the start time point of of the Trend Line (instead of Point in drawing tool). The default setting is Resistance Trend Line, so user may opt for the time point where the user finds a suitable high. However, as there is multiple confirmation in different stages, user may also opt for time point where the user intend to place the support line start.:
https://photos.google.com/share/AF1QipMrZk304KJPp7FNMWxmzRvrnYRMPrfFNFL60IOShGVH7yFHQVDOObPchBZe-lbW6A/photo/AF1QipNoZTob0Q5cjHiUOlWR4tr0z8MVwBEoGyTDAznN?key=bjNlMFhfbV93ZTd5aDN3ZTVRTEwxMjU4LXdZMTVn
Once user choose the start time point, it will ask the end time point as per the below screenshot:
https://photos.google.com/share/AF1QipMrZk304KJPp7FNMWxmzRvrnYRMPrfFNFL60IOShGVH7yFHQVDOObPchBZe-lbW6A/photo/AF1QipM_fo00CYaIMeSPBEg0vCmu1p1_SfUREpUhoLDt?key=bjNlMFhfbV93ZTd5aDN3ZTVRTEwxMjU4LXdZMTVn
Once the second point is also chosen, then the following screen appears for user to confirm other parameters:
https://photos.google.com/share/AF1QipMrZk304KJPp7FNMWxmzRvrnYRMPrfFNFL60IOShGVH7yFHQVDOObPchBZe-lbW6A/photo/AF1QipOw_58x9DTV67hMXCks8Rqi3XazyakcjfyBpUKC?key=bjNlMFhfbV93ZTd5aDN3ZTVRTEwxMjU4LXdZMTVn
User can choose:
1. Trend Line Type: Resistance or Support
2. Trend Line Touch Points: Either High/Low of the candle (when resistance, it will touch the highs, when support, it will touch the lows for the selected time point candles.) or candle body (in this case, the trendline will touch the high of the candle body when Resistance is selected else it will touch the low of the candle body when Support is selected.)
3. Trend Line Visibility: Single Line or Multiple Line. The default screenshot with this publication shows the multiple line where the center dashed line is the touch points and outer solid lines are indicating a narrow zone. This zone is to cover some other high (or low points) which didn't exactly touch the dashed line but the rejection came to very near to it.
Once you click apply, say with other default setting except the time point, the trendline will be visible like the below screenshot:
https://photos.google.com/share/AF1QipMrZk304KJPp7FNMWxmzRvrnYRMPrfFNFL60IOShGVH7yFHQVDOObPchBZe-lbW6A/photo/AF1QipM23aN9_ylW0pzpcbyIIVcogt6Jab1yVJ-RuzSM?key=bjNlMFhfbV93ZTd5aDN3ZTVRTEwxMjU4LXdZMTVn
By default the Trend Line is extended left but it stops at the current running or the last historical bar with a small value mentioned at the right of the Trend Line as the price value of it at the current bar.
Also by default the resistance selection colors the line as Red and Green when selected support.
User can go into the settings and fiddle with it for other settings. If the line visibility is changed to Multiple Line, the Trend Line in the just previous picture will become multiple line as is below:
https://photos.google.com/share/AF1QipMrZk304KJPp7FNMWxmzRvrnYRMPrfFNFL60IOShGVH7yFHQVDOObPchBZe-lbW6A/photo/AF1QipOkxNLtlvJRYwqD5uzXRCoCJa5o9IglFOauv4h8?key=bjNlMFhfbV93ZTd5aDN3ZTVRTEwxMjU4LXdZMTVn
Other parameter are:
1. Line Thickness: For single line type, the thickness can be made from 1 to 10.
2. The label size can be made from 8 to 16 for the Price Value of the Trend Line at current bar.
Draggability:
Unlike Built-in Trendline, this doesn't have the efficiency of dragging the start or endpoints but it has the another ability to drag the start and end time of the Trend Line. In that case, you just select the Trend Line and two vertical lines will appear on your chart on the start and end point of the Trend Line. User can drag the vertical time points to whichever bar user want to place to.
In this way, the semiautomatic "Manual Trend Line" can be drawn on the chart but with some additional features as mentioned earlier.
This Indicator is free for all but I'm hiding the source code for some unforeseen reasons. If Both the Upper Trend Line and Lower Trend Lines are required on a single chart, then the indicator should be added two times on the chart, that's it.
If user faces any issues during placement of the Indicator on the chart, I may be contacted over TradingView direct message and can help the user for any clarifications, overcoming any issues.
Nota Keluaran
An error was observed in live chart. The bug has been fixed.Skrip dilindungi
Skrip ini diterbitkan sebagai sumber tertutup. Akan tetapi, anda boleh menggunakannya secara bebas dan tanpa apa-apa had – ketahui lebih di sini.
Penafian
Maklumat dan penerbitan adalah tidak bertujuan, dan tidak membentuk, nasihat atau cadangan kewangan, pelaburan, dagangan atau jenis lain yang diberikan atau disahkan oleh TradingView. Baca lebih dalam Terma Penggunaan.
Skrip dilindungi
Skrip ini diterbitkan sebagai sumber tertutup. Akan tetapi, anda boleh menggunakannya secara bebas dan tanpa apa-apa had – ketahui lebih di sini.
Penafian
Maklumat dan penerbitan adalah tidak bertujuan, dan tidak membentuk, nasihat atau cadangan kewangan, pelaburan, dagangan atau jenis lain yang diberikan atau disahkan oleh TradingView. Baca lebih dalam Terma Penggunaan.