PROTECTED SOURCE SCRIPT
DRT - OR with Fib Extensions [TraderVlad]
Overview
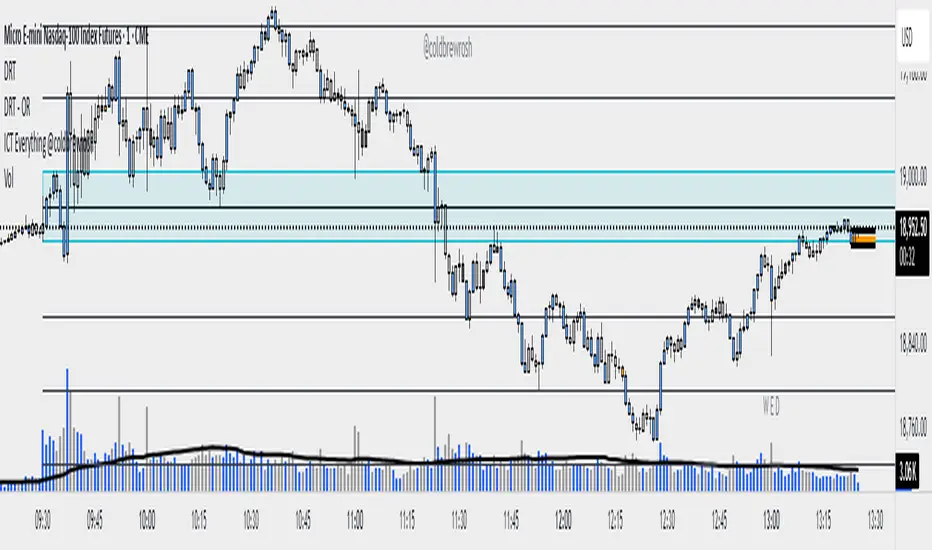
The "DRT - OR [TraderVlad]" indicator is a versatile tool for intraday traders, designed to highlight the opening range (OR) of a market session based on a user-defined timeframe and start time.
It captures the high and low of the first candle at the specified time (default: 9:00 AM Berlin/Europe time, 30-second timeframe), plots a visual box to mark this range, and adds a 50% midpoint line as a potential pivot level.
This indicator is perfect for traders focusing on key market openings, such as the European session (e.g., for DAX, EUR/USD) or other sessions of your choice.
It’s highly customizable, allowing you to adjust the timeframe, start time, timezone, and visual styles to fit your trading strategy.
How It Works
The indicator operates in a straightforward way to provide clear insights:
Captures the Opening Range:
At the specified start time (default: 9:00 AM Berlin/Europe time), the indicator identifies the first candle in the chosen timeframe (default: 30 seconds).
It records the high (highest price) and low (lowest price) of this candle to define the opening range.
The range size is calculated as High - Low.
Draws the Opening Range Box:
A box is drawn on the chart, starting at the specified time and extending to the next day’s start time (or far into the future for the most recent day).
The top of the box is the high, and the bottom is the low, visually marking the range.
Plots the 50% Midpoint Line:
A horizontal line is drawn at the 50% level of the range (calculated as (High + Low) / 2).
This line extends alongside the box, helping you identify a potential pivot point within the range.
Weekday-Only Operation:
The indicator only draws ranges on weekdays (Monday to Friday), skipping weekends when markets are typically closed.
Display Limit:
You can control how many days’ worth of ranges are shown (default: 5 days).
Older ranges are automatically removed to keep your chart clean.
Trading Applications
The opening range often sets the tone for the trading session.
Here’s how to use this indicator:
Identify Key Levels:
The top and bottom of the box (high and low) can act as support and resistance levels.
A breakout above the high or below the low may indicate a directional move.
Use the 50% Midpoint:
The midpoint line can serve as a pivot point within the range.
Price may find support or resistance at this level before breaking out.
Analyze Range Size:
The label shows the range size, helping you gauge volatility at the open.
A larger range suggests higher volatility, while a smaller range indicates a quieter start.
Flexible Application:
Use the indicator for any market session by adjusting the timezone and start time (e.g., 9:30 AM New York for US markets).
Combine with other indicators (e.g., volume, RSI) to confirm trades based on the opening range.
This indicator is part of the DRT (Dynamic Range Theory) series by TraderVlad, aimed at helping traders identify critical price levels at key market openings.
Feedback and suggestions are welcome to improve this tool further!
Skrip dilindungi
Skrip ini diterbitkan sebagai sumber tertutup. Akan tetapi, anda boleh menggunakannya secara bebas dan tanpa apa-apa had – ketahui lebih di sini.
Penafian
Maklumat dan penerbitan adalah tidak bertujuan, dan tidak membentuk, nasihat atau cadangan kewangan, pelaburan, dagangan atau jenis lain yang diberikan atau disahkan oleh TradingView. Baca lebih dalam Terma Penggunaan.