[blackcat] L5 Price Positioning Index Strategy
Background
Are you tired of traditional Japanese candlesticks? Do you want to try a new type of candle master chart? This is my private L5 version, which introduces "Market Season Bands" for oversold and overbought status, historical resistance and support arrows in dynamic forms, inherent pyramiding for buy and sell.
Function
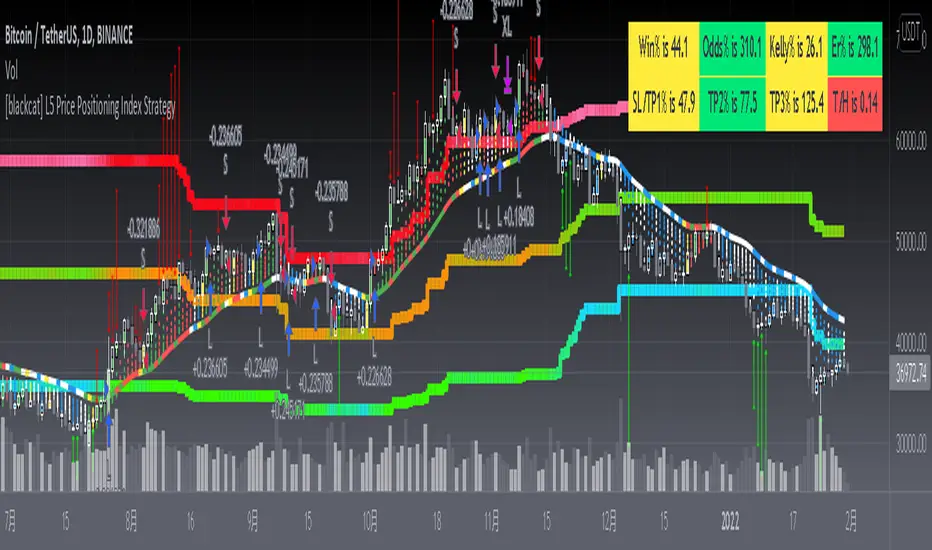
L3 Price Positioning Index is totally brand-new candle chart invented by myself. This main chart can provide effective resistance and support levels, and you can see where the price is running at any time. There are 3 key color bands. Blue-Green gredient band is used to indicate oversold support or breakthrough support levels; the color is blue means extreme oversold, green means oversold you can ignore. This band indicates the season of market entering "Winter". The Green-Orange band indicates the midline position where prices may pause; the green color here means bear middle while orange color here means bull middle. Accordingly, middle band color indicates market season entering "Spring or Autumn" . Finally, Pink-Red band indicates overbought resistance or breakthrough resistance levels; the pink color means market season is NOT bullish while the red color indicates it is a good market season to long. top band color indicates the market season entering "Summer". Enjoy your "Summer" with profit!
There are two types of candlestick charts.
The first type candles are mid-to-long-term trend candles, navy represents an uptrend and the length of the candle represents a change in intensity; maroon represents a downward trend and the length of the candle represents a change in intensity. You can find principle in L5 Price Positioning Index code. In L5 version, to simplif the visual effect, the display is hidden. This trend candle is the effective support and resistance level of the second type short-term swing candle.
The second type candles are short-term candles fluctuate around the first medium- and long-term trend candles. The second short-term candle is divided into five colors: green means pump; red means retracement in the ascending process; blue and yellow means bearish rebounce and trend reversal signal; white means dump; blue means price rebound in the descending process. I describe these in raindrop or snow-drop form, which can be quite familar for you to imagine the temperature of the market :).
Key Signal
THREE KEY LINES:
htop --> Pink-Red band, "Market in Summer", overbought resistance or pump breakout threshold
hmid --> Green-Orange band, "Market in Spring or Autumn", price pause zone, sideways may happen here
hbot --> Blue-Green gredient band, "Market in Winter", oversold support or dump breakout threshold
MID-LONG TERM CANDLES:
colorful trend line , it is an important support or resistance for short term price movements and the bull-bear boundary for market seasons.
SHORT TERM CANDLES:
1. bear rebounance --> rebounce in down trend candle with blue color
2. pump --> up trend pump candle with green color
3. trend reversal --> trend reversal candle with yellow color
4. dump --> bearish dump candle with white color
5. bull retracement --> retracement in up trend candle with red
Pros and Cons
Pros:
1. Long term trend identification by three lines for overbought, oversold and breakouts
2. Mid term trend support and resistance with a colorful boundary
3. Short term price behaviors are classified into 5 types of candles in blue, green, yellow, red and white
Cons:
I invent this to solve traditional JP candlestick shortcomings. If you find anything on Cons, just feedback to me for improvements.
Remarks
1. This is the strategy version of L5 Price Positioning Index
2. Closed-source, Invite-only, NOT free. (Free version is available by search "L3 Price Positioning Index")
3. Highl recommended to use this indicator for >= 4H timeframe, which means this is powerful for swing trading.
4. IMPORTANT!!! To have superior visual effect, you need to enter "Chart Setting" --> "Symbol" --> TURN OFF "Body", "Borders" and "Wick" of traditional JP candles.
Subscription
Permission will be automatically granted for who subscribed " L5 Price Positioning Index for Market Seasons"
Skrip jemputan sahaja
Hanya pengguna disahkan oleh penulis boleh mengakses skrip ini. Anda perlu memohon dan mendapatkan kebenaran untuk menggunakannya. Keizinan selalunya diberikan selepas pembayaran. Untuk lebih butiran, ikuti arahan penulis di bawah atau hubungi blackcat1402 secara terus.
TradingView TIDAK menyarankan pembayaran atau penggunaan skrip kecuali anda mempercayai sepenuhnya penulis dan memahami bagaimana ia berfungsi. Anda juga boleh menjumpai alternatif sumber terbuka dan percuma yang lain di dalam skrip komuniti kami.
Arahan penulis
Penafian
Skrip jemputan sahaja
Hanya pengguna disahkan oleh penulis boleh mengakses skrip ini. Anda perlu memohon dan mendapatkan kebenaran untuk menggunakannya. Keizinan selalunya diberikan selepas pembayaran. Untuk lebih butiran, ikuti arahan penulis di bawah atau hubungi blackcat1402 secara terus.
TradingView TIDAK menyarankan pembayaran atau penggunaan skrip kecuali anda mempercayai sepenuhnya penulis dan memahami bagaimana ia berfungsi. Anda juga boleh menjumpai alternatif sumber terbuka dan percuma yang lain di dalam skrip komuniti kami.