PROTECTED SOURCE SCRIPT
Telah dikemas kini Fibonacci MTF Retracement & Extension levels
Overview:
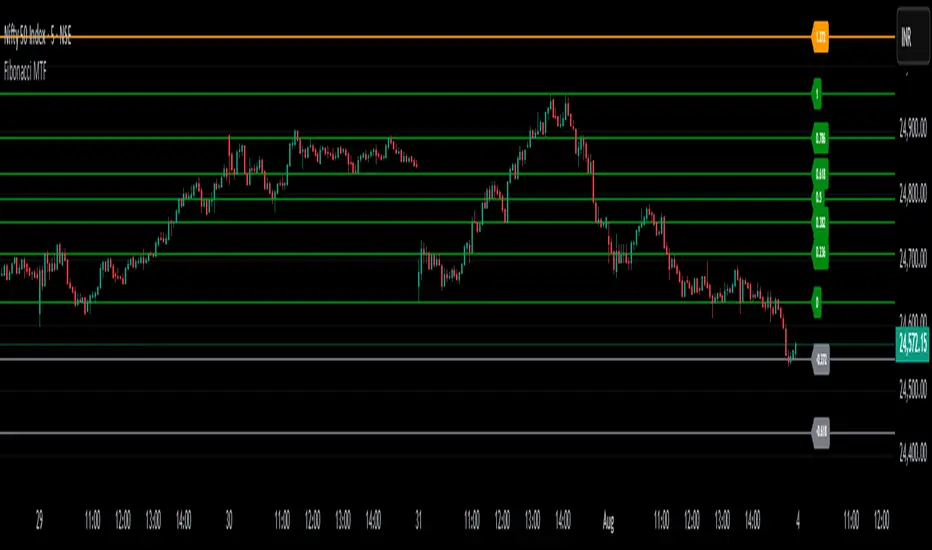
This indicator plots Fibonacci retracement and extension levels based on either yesterday's or today's high-low range on a customizable timeframe (default: daily). It is useful for identifying potential support/resistance zones and projecting price targets using Fibonacci ratios.
Features:
Custom Reference Timeframe
Choose any timeframe (e.g., Daily, Weekly, 4H) as the source for high and low calculations.
Flexible Level Source:
Choose to plot either: Yesterday’s Fibonacci levels (default), or Today's real-time Fibonacci levels
Extensive Fibonacci Levels:
Supports both common and extended levels, including: 6.0, -5.618, ..., 0.0, 0.382, 0.618, 1.0, 1.618, ..., 6.0
Customizable Style:
Line width and style (solid, dotted, dashed)
Color-coded for negative, main (0 to 1), and above-1 levels
Adjustable label size, text color, and label position (offset)
Efficient and Clean Visualization:
Automatically clears previous drawings on each new candle of selected timeframe Optimized to prevent clutter and overlap
How It Works:
Yesterday Mode: Plots fib levels based on the high/low of the previous candle on your selected timeframe.
Today Mode: Plots fib levels using the current high/low of the ongoing candle.
All lines and labels automatically refresh at the open of each new candle (on your selected timeframe).
Nota Keluaran
Fibonacci MTF – Multi-Timeframe Fibonacci LevelsThis script plots dynamic Fibonacci retracement and extension levels based on either today's or yesterday’s price range from a selected reference timeframe (MTF). It's a powerful tool for traders who use Fibonacci levels to identify potential support/resistance zones, reversal areas, or trend continuation levels across different timeframes.
Features
Multi-Timeframe Support
Choose any higher timeframe (e.g., Daily, Weekly, Monthly) as a reference for the high/low range used to calculate Fibonacci levels.
Fibonacci Levels Included
Negative extensions (e.g., -0.618, -1.618, -2.618, etc.)
Standard retracements (0.236, 0.382, 0.5, 0.618, 0.786)
Positive extensions (1.272, 1.618, 2.0, ... up to 6.0)
Customizable Visuals
Line style (solid, dotted, dashed)
Line width
Label color, text size, and horizontal offset
Different colors for negative levels, standard levels (0–1), and extensions above 1
Today's vs Yesterday's Levels
Choose whether to plot Fibonacci levels based on:
Yesterday’s Range (default)
Today’s Range (current in-progress candle)
Automatic Updates
Levels update automatically when a new candle forms on the selected reference timeframe. Old lines/labels are removed and redrawn cleanly.
Skrip dilindungi
Skrip ini diterbitkan sebagai sumber tertutup. Akan tetapi, anda boleh menggunakannya dengan percuma dan tanpa had – ketahui lebih lanjut di sini.
Penafian
Maklumat dan penerbitan adalah tidak dimaksudkan untuk menjadi, dan tidak membentuk, nasihat untuk kewangan, pelaburan, perdagangan dan jenis-jenis lain atau cadangan yang dibekalkan atau disahkan oleh TradingView. Baca dengan lebih lanjut di Terma Penggunaan.