OPEN-SOURCE SCRIPT
Yope BTC PL channel
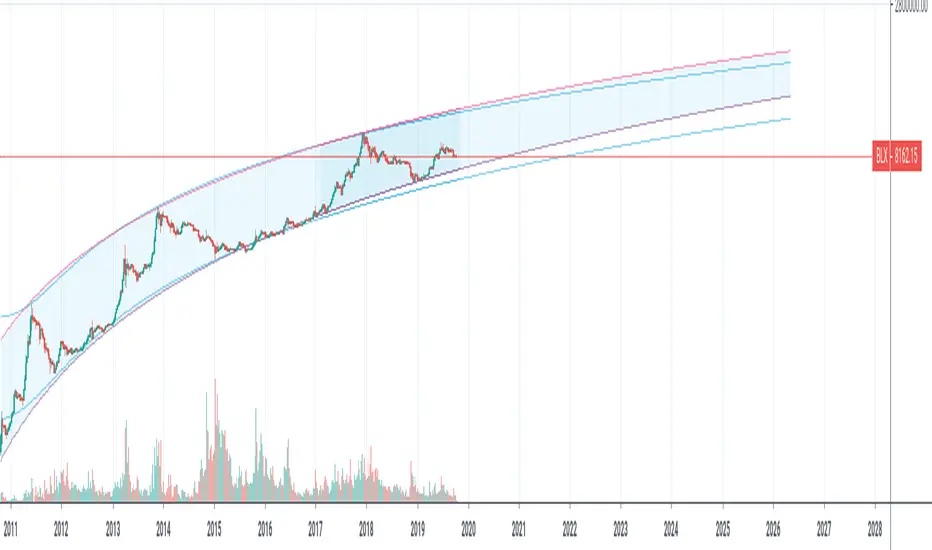
This is a new version of the old "Yope BTC tops channel", but modified to reflect a power-law curve fitted, similar to the model proposed by Harold Christopher Burger in his medium article "Bitcoin’s natural long-term power-law corridor of growth".
My original tops channel fitting is still there for comparison. In fact, it looks like the old tops channel was a bit too pessimistic.
Note that these channels are still pure naive curve-fitting, and do not represent an underlying model that explains it, like is the case for PlanB's "Modeling Bitcoin's Value with Scarcity" which uses Stock-to-Flow.
The motivation for this exercise is to observe how long this empirical extrapolation is valid. Will the price of bitcoin stay in either of both channels?
Note on usage: This script _only_ works with the BLX "BraveNewCoin Liquid Index for Bitcoin" in the 1D, 3D and 1W time-frames!
It may be necessary to zoom in and out a few times to overcome drawing glitches caused by the extreme time-shifting of plots in order to draw the extrapolated part.
Skrip sumber terbuka
Dalam semangat TradingView sebenar, pencipta skrip ini telah menjadikannya sumber terbuka, jadi pedagang boleh menilai dan mengesahkan kefungsiannya. Terima kasih kepada penulis! Walaupuan anda boleh menggunakan secara percuma, ingat bahawa penerbitan semula kod ini tertakluk kepada Peraturan Dalaman.
Penafian
Maklumat dan penerbitan adalah tidak bertujuan, dan tidak membentuk, nasihat atau cadangan kewangan, pelaburan, dagangan atau jenis lain yang diberikan atau disahkan oleh TradingView. Baca lebih dalam Terma Penggunaan.