PROTECTED SOURCE SCRIPT
Market Divergence (Line version) ©MBYLAB
Good morning.
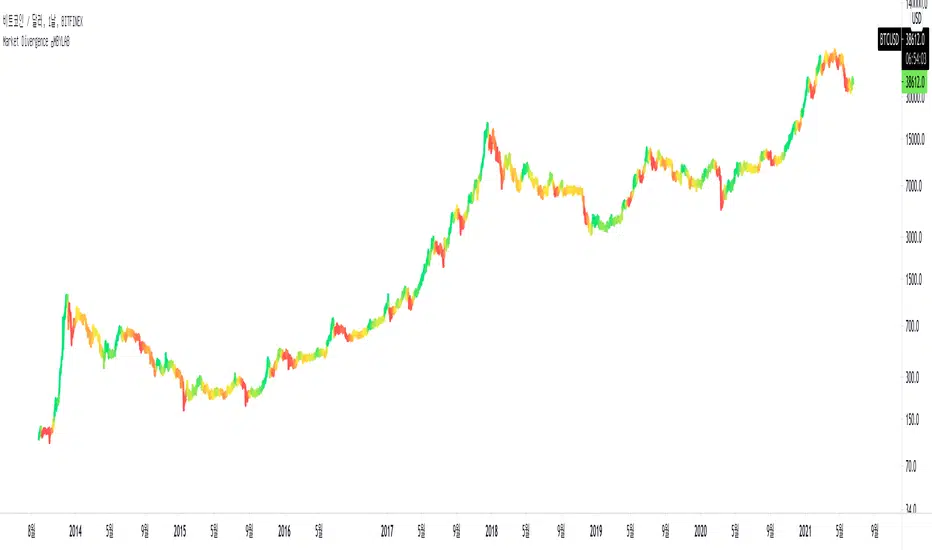
This indicator measures the distance between the moving average line and the current price position, so you can check the price divergence.
logic
In general, when the closing price breaks below the moving average and closes, it can be interpreted as downward divergence.
Based on the logic described above, this indicator will have a darker color as the current price position is further away from the set moving average.
When this indicator starts changing from red to yellow, it can be interpreted that the trend is reversing.(Bearish -> Bullish)
How to use
First, set the existing candle chart in the upper left to invisible and then apply the corresponding indicator.
Anyone can use this indicator, no special conditions are required.
Skrip dilindungi
Skrip ini diterbitkan sebagai sumber tertutup. Akan tetapi, anda boleh menggunakannya secara bebas dan tanpa apa-apa had – ketahui lebih di sini.
Hi, im Quant from KR
Penafian
Maklumat dan penerbitan adalah tidak bertujuan, dan tidak membentuk, nasihat atau cadangan kewangan, pelaburan, dagangan atau jenis lain yang diberikan atau disahkan oleh TradingView. Baca lebih dalam Terma Penggunaan.