OPEN-SOURCE SCRIPT
Telah dikemas kini SATHYA SMA Signal)
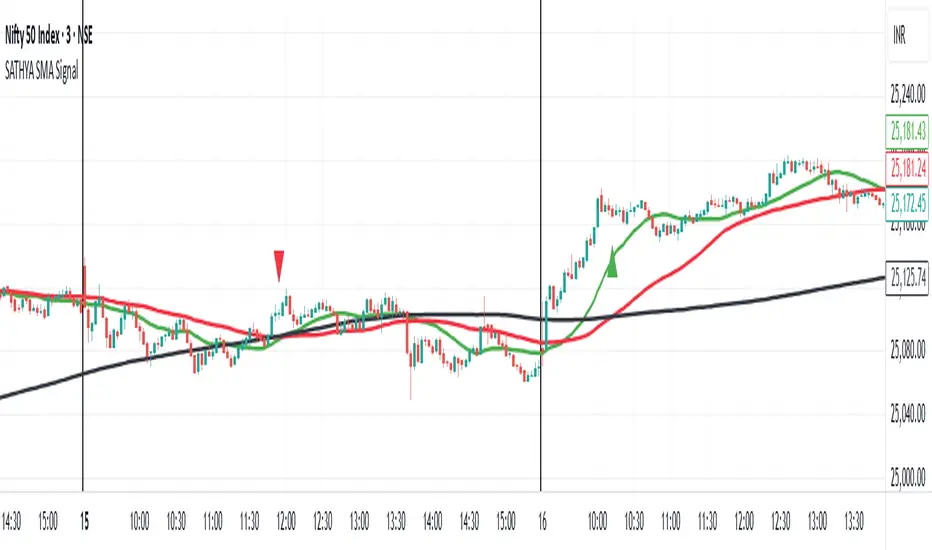
This indicator overlays 20, 50, and 200 Simple Moving Averages (SMAs) on the chart. It generates bullish signals when the 20 SMA crosses above the 200 SMA before the 50 SMA, with both above 200 SMA. Bearish signals occur when the 20 SMA crosses below the 200 SMA before the 50 SMA, with both below 200 SMA. Signals appear as distinct triangles on the chart, helping traders identify trend reversals based on systematic SMA crossovers and order of crossing.
Nota Keluaran
This indicator overlays 20, 50, and 200 Simple Moving Averages (SMAs) on the chart. It generates bullish signals when the 20 SMA crosses above the 200 SMA before the 50 SMA, with both above 200 SMA. Bearish signals occur when the 20 SMA crosses below the 200 SMA before the 50 SMA, with both below 200 SMA. Signals appear as distinct triangles on the chart, helping traders identify trend reversals based on systematic SMA crossovers and order of crossing.Skrip sumber terbuka
Dalam semangat TradingView sebenar, pencipta skrip ini telah menjadikannya sumber terbuka, jadi pedagang boleh menilai dan mengesahkan kefungsiannya. Terima kasih kepada penulis! Walaupuan anda boleh menggunakan secara percuma, ingat bahawa penerbitan semula kod ini tertakluk kepada Peraturan Dalaman.
Penafian
Maklumat dan penerbitan adalah tidak bertujuan, dan tidak membentuk, nasihat atau cadangan kewangan, pelaburan, dagangan atau jenis lain yang diberikan atau disahkan oleh TradingView. Baca lebih dalam Terma Penggunaan.
Skrip sumber terbuka
Dalam semangat TradingView sebenar, pencipta skrip ini telah menjadikannya sumber terbuka, jadi pedagang boleh menilai dan mengesahkan kefungsiannya. Terima kasih kepada penulis! Walaupuan anda boleh menggunakan secara percuma, ingat bahawa penerbitan semula kod ini tertakluk kepada Peraturan Dalaman.
Penafian
Maklumat dan penerbitan adalah tidak bertujuan, dan tidak membentuk, nasihat atau cadangan kewangan, pelaburan, dagangan atau jenis lain yang diberikan atau disahkan oleh TradingView. Baca lebih dalam Terma Penggunaan.