OPEN-SOURCE SCRIPT
Telah dikemas kini Elgrand - Overbought/sold Rsi + Stochastic zones
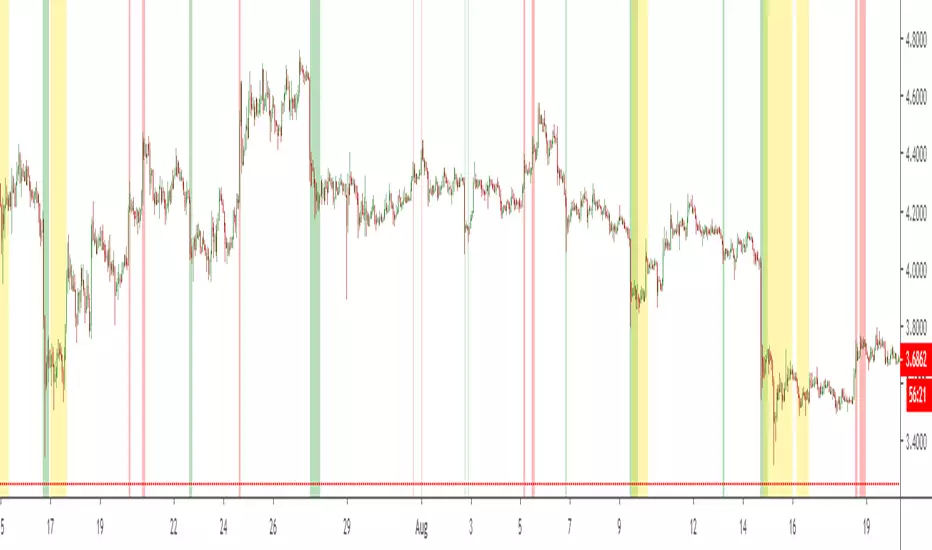
Visualize on your chart when price in an oversold or overbought zone. A combination of Rsi and Stochasticrsi is used for higher probability. Wait for an zone to be displayed and then wait for price to exit a zone. Once this happens check candlestick patterns and support/resistance "lines" to find appropiate stoplosses for you entry or exit
Nota Keluaran
Update :- Upgraded to use version 4 of Pinescript
Added and extra timeframe which will show in yellow on your chart : this way you can decide to enter exit if 1H overbought/oversold is also happening on the 4H timeframe. Idea is that this will lower your entry/exit risk.
Todo :
- Make the parent timeframe display optional
Be able to choose per timeframe which parent timeframe you would like to use
Skrip sumber terbuka
Dalam semangat TradingView sebenar, pencipta skrip ini telah menjadikannya sumber terbuka, jadi pedagang boleh menilai dan mengesahkan kefungsiannya. Terima kasih kepada penulis! Walaupuan anda boleh menggunakan secara percuma, ingat bahawa penerbitan semula kod ini tertakluk kepada Peraturan Dalaman.
Penafian
Maklumat dan penerbitan adalah tidak bertujuan, dan tidak membentuk, nasihat atau cadangan kewangan, pelaburan, dagangan atau jenis lain yang diberikan atau disahkan oleh TradingView. Baca lebih dalam Terma Penggunaan.