OPEN-SOURCE SCRIPT
Bullish/Bearish Body Strength
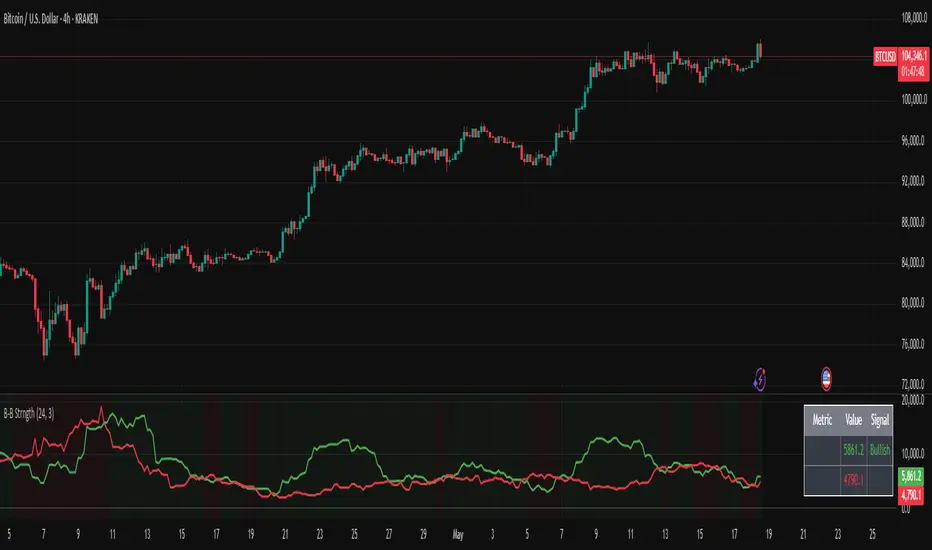
This indicator analyzes candlestick body sizes to measure bullish versus bearish strength over a specified period. Here's what it does:
Features:
- Measures and totals the body sizes of bullish and bearish candles over your chosen lookback period
- Shows the total bullish and bearish body measurements as separate plots
- Calculates and displays a bull/bear ratio (bullish total divided by bearish total)
- Shows the difference between bullish and bearish totals
- Colors the background based on bullish (green) or bearish (red) dominance
- Includes an information table with current values and signals
Customization Options:
- Lookback Period: Set how many bars to analyze (default: 14)
- Normalize by ATR: Option to normalize body sizes by the Average True Range for more consistent measurement across different volatility periods
- Smoothing Period: Apply smoothing to the ratio and difference values
- Display Options: Toggle for showing the bull/bear ratio and bull-bear difference
How to Use:
1. Add the indicator to your chart in TradingView
2. Adjust the lookback period to fit your trading timeframe
3. Watch for:
- When bullish bodies significantly outweigh bearish ones (green dominance)
- When bearish bodies significantly outweigh bullish ones (red dominance)
- Ratio values above 2 (strong bullish signal) or below 0.5 (strong bearish signal)
The indicator provides both visual cues and numerical data to help identify periods of bullish or bearish momentum based on actual price movement rather than just candle count.
Skrip sumber terbuka
In true TradingView spirit, the creator of this script has made it open-source, so that traders can review and verify its functionality. Kudos to the author! While you can use it for free, remember that republishing the code is subject to our House Rules.
Penafian
The information and publications are not meant to be, and do not constitute, financial, investment, trading, or other types of advice or recommendations supplied or endorsed by TradingView. Read more in the Terms of Use.