OPEN-SOURCE SCRIPT
VWAP Trend
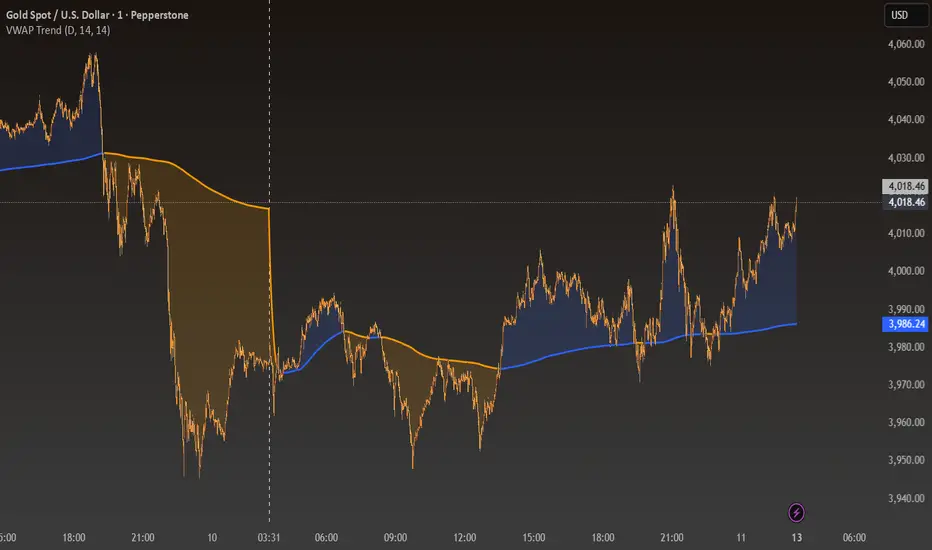
The VWAP Trend indicator is a powerful visualization tool that blends a smoothed Volume-Weighted Average Price (VWAP) with a trend-following EMA to reveal the underlying market bias in a clear, color-coded format.
Unlike a standard VWAP that only resets intraday, VWAP Trend allows traders to anchor VWAP calculations to Daily, Weekly, or Monthly sessions. This flexibility makes it suitable for all trading styles — from intraday scalping to long-term swing analysis.
The smoothed VWAP provides a stable representation of the true average price weighted by volume, while the EMA reflects the prevailing market trend. When the EMA remains above the VWAP, the indicator highlights bullish conditions with blue tones. When it moves below, bearish momentum is displayed with orange tones.
Features
Adjustable VWAP anchor timeframe (Daily, Weekly, or Monthly)
Smoothed VWAP for reduced noise and improved accuracy
Dynamic EMA overlay for real-time trend detection
Color-coded shading between price and VWAP
Minimalist design ideal for clean chart analysis
How to Use
Select your preferred VWAP anchor timeframe.
Observe how the shading color shifts between blue (bullish) and orange (bearish).
Use these transitions to gauge market bias, confirm trade setups, or identify potential mean reversion zones.
Skrip sumber terbuka
Dalam semangat sebenar TradingView, pencipta skrip ini telah menjadikannya sumber terbuka supaya pedagang dapat menilai dan mengesahkan kefungsiannya. Terima kasih kepada penulis! Walaupun anda boleh menggunakannya secara percuma, ingat bahawa menerbitkan semula kod ini adalah tertakluk kepada Peraturan Dalaman kami.
Penafian
Maklumat dan penerbitan adalah tidak dimaksudkan untuk menjadi, dan tidak membentuk, nasihat untuk kewangan, pelaburan, perdagangan dan jenis-jenis lain atau cadangan yang dibekalkan atau disahkan oleh TradingView. Baca dengan lebih lanjut di Terma Penggunaan.