OPEN-SOURCE SCRIPT
Telah dikemas kini HL avg MTF
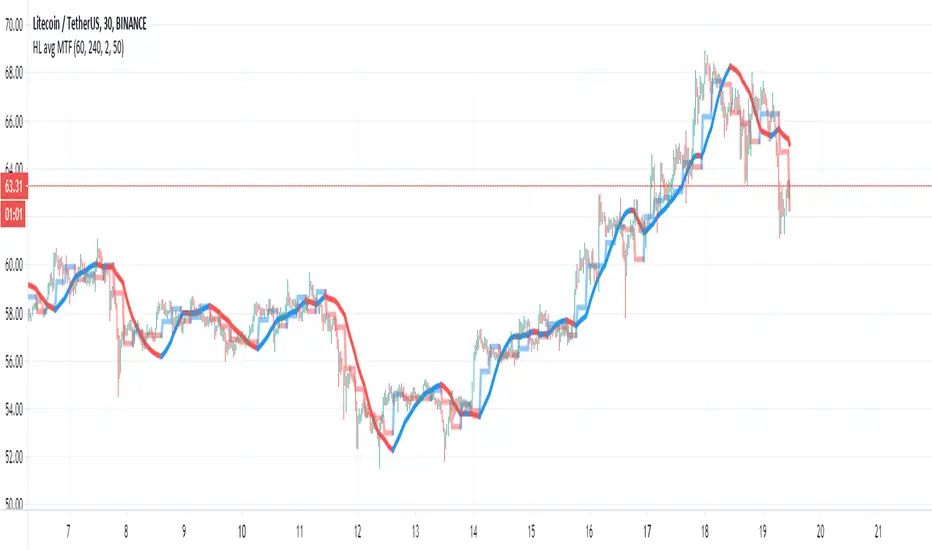
This indicator try to find trends more accurate
So first step is to make candle MTF and to find the average of high and low of the MTF candle. I think a ratio of 4/1 is good .
so this seen in the lime /red line
after we take this line and transform it to linear regression type . I use here 50 candle size seen in blue line
if close are above the blue line then we are above the avg of the high and low of the mtf candle .. this indicate a positive trend. if we close is bellow the blue line then it a negative trend and it good time to short it .
also very important is the direction of the blue line as it give us the direction of the trend
Nota Keluaran
add trend color instead the blue line using the code that fikira posted I think now it better
thanks for fikira for this improvment
Nota Keluaran
change the way the XY which is the mean line of high and low +add signal to itThis is a modified script based on Alex grover trend detection method for link to original study for this method 'scroll down in script for lik
Nota Keluaran
try to fix issue of repaintSkrip sumber terbuka
Dalam semangat TradingView sebenar, pencipta skrip ini telah menjadikannya sumber terbuka, jadi pedagang boleh menilai dan mengesahkan kefungsiannya. Terima kasih kepada penulis! Walaupuan anda boleh menggunakan secara percuma, ingat bahawa penerbitan semula kod ini tertakluk kepada Peraturan Dalaman.
Penafian
Maklumat dan penerbitan adalah tidak bertujuan, dan tidak membentuk, nasihat atau cadangan kewangan, pelaburan, dagangan atau jenis lain yang diberikan atau disahkan oleh TradingView. Baca lebih dalam Terma Penggunaan.
Skrip sumber terbuka
Dalam semangat TradingView sebenar, pencipta skrip ini telah menjadikannya sumber terbuka, jadi pedagang boleh menilai dan mengesahkan kefungsiannya. Terima kasih kepada penulis! Walaupuan anda boleh menggunakan secara percuma, ingat bahawa penerbitan semula kod ini tertakluk kepada Peraturan Dalaman.
Penafian
Maklumat dan penerbitan adalah tidak bertujuan, dan tidak membentuk, nasihat atau cadangan kewangan, pelaburan, dagangan atau jenis lain yang diberikan atau disahkan oleh TradingView. Baca lebih dalam Terma Penggunaan.