CommonMarkup
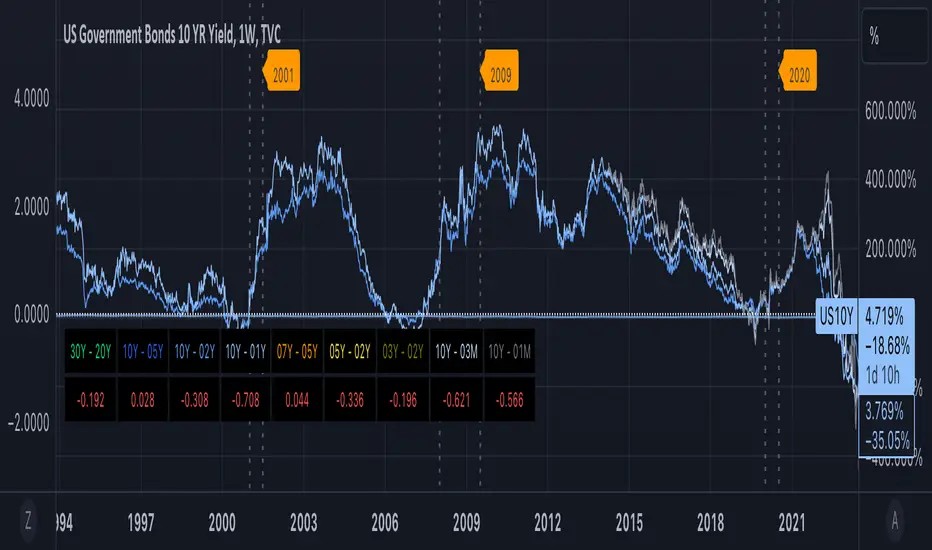
Provides functions for chart markup, such as indicating recession bands.
markRecessionBands(showBands, lineY, labelY)
Mark vertical bands and show recession band labels if argument showBands is true. Example "markRecessionBands(bar_index[0],3.0"
Parameters:
showBands: - show vertical recession bands when true. Functionally equiv to no op when false
lineY: - y-axis value for line positioning
labelY: - y-axis value for label positioning
return true - always answers the value of showBands
- Added 2022 contraction over Q1 to Q2
- Updated time refs to be UTC+0
Added control parameter for defining if 2 consecutive quarters of negative GDP is considered a recession
Updated:
markRecessionBands(showBands, twoQrtsOfNegativeGDPIsRecession, lineY, labelY)
Mark vertical bands and show recession band labels if argument showBands is true. Example "markRecessionBands(bar_index[0],3.0"
Parameters:
showBands: - show vertical recession bands when true. Functionally equiv to no op when false
twoQrtsOfNegativeGDPIsRecession: - if true, then periods with two consecutive quarters of negative GDP is considered a recession. Defaut is false.
lineY: - y-axis value for line positioning
labelY: - y-axis value for label positioning
return true - always answers the value of showBands
Updated:
markRecessionBands(showBands, twoQrtsOfNegativeGDPIsRecession, labelY)
Mark vertical bands and show recession band labels if argument showBands is true. Example "markRecessionBands(bar_index[0],false3.0)"
Parameters:
showBands (bool): - show vertical recession bands when true. Functionally equiv to no op when false
twoQrtsOfNegativeGDPIsRecession (bool): - if true, then periods with two consecutive quarters of negative GDP are considered a recession. Defaut is false.
labelY (float): - y-axis value for label positioning
return true - always answers the value of showBands
Updated:
- Resolved issue with private function for drawing recession bands scaling the y-axis excessively
Perpustakaan Pine
Dalam semangat TradingView sebenar, penulis telah menerbitkan kod Pine ini sebagai perpustakaan sumber terbuka supaya pengaturcara Pine lain dari komuniti kami boleh menggunakannya semula. Sorakan kepada penulis! Anda boleh menggunakan perpustakaan ini secara peribadi atau dalam penerbitan sumber terbuka lain, tetapi penggunaan semula kod ini dalam penerbitan adalah dikawal selia oleh Peraturan Dalaman.
Penafian
Perpustakaan Pine
Dalam semangat TradingView sebenar, penulis telah menerbitkan kod Pine ini sebagai perpustakaan sumber terbuka supaya pengaturcara Pine lain dari komuniti kami boleh menggunakannya semula. Sorakan kepada penulis! Anda boleh menggunakan perpustakaan ini secara peribadi atau dalam penerbitan sumber terbuka lain, tetapi penggunaan semula kod ini dalam penerbitan adalah dikawal selia oleh Peraturan Dalaman.