PROTECTED SOURCE SCRIPT
Telah dikemas kini [EAK]Median Growth% Hist. Vs Estimate
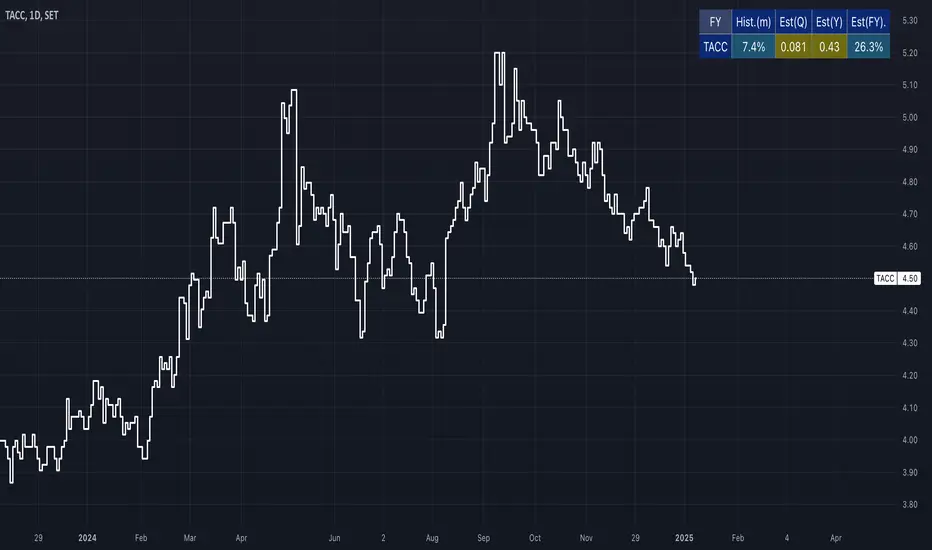
=Indicator "[EAK] Growth rate (Hist.VS Est.)" ซึ่งใช้แสดงอัตราการเติบโตของของบริษัท โดยเปรียบเทียบระหว่างข้อมูลในอดีต (Historical) กับการประมาณการ (Estimate) การตั้งค่าต่างๆ มีดังนี้
Inputs (ข้อมูลนำเข้า): ส่วนนี้ใช้กำหนดรายละเอียดของข้อมูลที่นำมาคำนวณ
-Period (ช่วงเวลา): เลือกช่วงเวลาที่ต้องการวิเคราะห์ เช่น TTM (Trailing Twelve Months) คือ 12 เดือนล่าสุด หรือ FY ที่ใช้ข้อมูลของปีล่าสุด
-Show EPS Growth% (แสดง % การเติบโตทบต้นของ EPS): เลือกให้แสดงเปอร์เซ็นต์การเติบโตเฉลี่ยทบต้นของ EPS
-Show Median Growth% (แสดง % การเติบโตมัธยฐาน): เลือกให้แสดงมัธยฐานของการเติบโตเฉลี่ยทบต้น
-Show EPS Estimate by TradingView (แสดงการประมาณการ EPS โดย TradingView): แสดงข้อมูลการประมาณการ EPS จาก TradingView(เป็นการเรียกข้อมูลล่าสุดที่มีในเทรดดิ้งวิว ดังนั้นโปรดตรวจสอบ ว่าเป็นข้อมูลของปีไหน)
-Position (ตำแหน่ง): กำหนดตำแหน่งการแสดงผลของ Indicator บนหน้าจอ เช่น middle_rigth... (กลาง_ขวา)
-Text Size (ขนาดตัวอักษร): กำหนดขนาดตัวอักษรของข้อมูลที่แสดง เช่น normal (ปกติ)

โดยสรุป Indicator นี้ช่วยให้เห็นภาพรวมของการเติบโตของกำไรบริษัท โดยเปรียบเทียบอดีตกับการคาดการณ์ ทำให้วิเคราะห์แนวโน้มและตัดสินใจลงทุนได้ง่ายขึ้น และการตั้งค่าต่างๆ ช่วยให้ปรับแต่งการแสดงผลให้เหมาะสมกับการใช้งานของผู้ใช้
หมายเหตุ
EPSm=EPS CAGR(Median)
REVm=Revenue CAGR(Median)
OPm=Operating income CAGR(Median)
DIVm=Dividend CAGR(Median)
EQm=Total Equity CAGR(Median)
ASm=Total Asset CAGR(Median)
***Indicatorนี้ ออกแบบมาใช้กับ กราฟDay1 เท่านั้น โดยใช้การเรียกข้อมูลด้วยการนับBarย้อนหลัง อาจมีการผิดพลาดได้บ้าง ดังนั้นหากต้องการความแม่นยำที่สูงโปรดตรวจสอบข้อมูลกับแหล่งข้อมูลที่น่าเชื่อถืออีกครั้ง***
/////////////////////////////////////////////////////////////////////////////////////////
Indicator "[EAK] Growth rate (Hist.VS Est.)" is designed to display a company's growth rate by comparing historical data with estimates. The configuration options are as follows:
Inputs:
Period: Select the analysis period, such as TTM (Trailing Twelve Months), representing the last 12 months, or FY, which uses last full year data.
Show EPS Growth%: Enables the display of the compound annual growth rate (CAGR) of EPS.
Show Median Growth%: Enables the display of the median of the compound annual growth rate.
Show EPS Estimate by TradingView: Displays EPS estimate data from TradingView. (This retrieves the latest data available in TradingView; therefore, please verify the corresponding fiscal year.)
Position: Sets the indicator's display position on the chart, such as middle_right.
Text Size: Sets the text size of the displayed information, such as normal.
In summary, this indicator provides an overview of a company's earnings growth by comparing historical performance with forecasts, facilitating trend analysis and investment decisions. The various settings allow users to customize the display for their specific needs.
Note:
EPSm = EPS CAGR (Median)
REVm = Revenue CAGR (Median)
OPm = Operating income CAGR (Median)
DIVm = Dividend CAGR (Median)
EQm = Total Equity CAGR (Median)
ASm = Total Asset CAGR (Median)
***This indicator is designed for use on daily (D1) charts only. As it retrieves data by counting back bars, some inaccuracies may occur. For accuracy, please cross-reference the information with reliable sources.
Inputs (ข้อมูลนำเข้า): ส่วนนี้ใช้กำหนดรายละเอียดของข้อมูลที่นำมาคำนวณ
-Period (ช่วงเวลา): เลือกช่วงเวลาที่ต้องการวิเคราะห์ เช่น TTM (Trailing Twelve Months) คือ 12 เดือนล่าสุด หรือ FY ที่ใช้ข้อมูลของปีล่าสุด
-Show EPS Growth% (แสดง % การเติบโตทบต้นของ EPS): เลือกให้แสดงเปอร์เซ็นต์การเติบโตเฉลี่ยทบต้นของ EPS
-Show Median Growth% (แสดง % การเติบโตมัธยฐาน): เลือกให้แสดงมัธยฐานของการเติบโตเฉลี่ยทบต้น
-Show EPS Estimate by TradingView (แสดงการประมาณการ EPS โดย TradingView): แสดงข้อมูลการประมาณการ EPS จาก TradingView(เป็นการเรียกข้อมูลล่าสุดที่มีในเทรดดิ้งวิว ดังนั้นโปรดตรวจสอบ ว่าเป็นข้อมูลของปีไหน)
-Position (ตำแหน่ง): กำหนดตำแหน่งการแสดงผลของ Indicator บนหน้าจอ เช่น middle_rigth... (กลาง_ขวา)
-Text Size (ขนาดตัวอักษร): กำหนดขนาดตัวอักษรของข้อมูลที่แสดง เช่น normal (ปกติ)
โดยสรุป Indicator นี้ช่วยให้เห็นภาพรวมของการเติบโตของกำไรบริษัท โดยเปรียบเทียบอดีตกับการคาดการณ์ ทำให้วิเคราะห์แนวโน้มและตัดสินใจลงทุนได้ง่ายขึ้น และการตั้งค่าต่างๆ ช่วยให้ปรับแต่งการแสดงผลให้เหมาะสมกับการใช้งานของผู้ใช้
หมายเหตุ
EPSm=EPS CAGR(Median)
REVm=Revenue CAGR(Median)
OPm=Operating income CAGR(Median)
DIVm=Dividend CAGR(Median)
EQm=Total Equity CAGR(Median)
ASm=Total Asset CAGR(Median)
***Indicatorนี้ ออกแบบมาใช้กับ กราฟDay1 เท่านั้น โดยใช้การเรียกข้อมูลด้วยการนับBarย้อนหลัง อาจมีการผิดพลาดได้บ้าง ดังนั้นหากต้องการความแม่นยำที่สูงโปรดตรวจสอบข้อมูลกับแหล่งข้อมูลที่น่าเชื่อถืออีกครั้ง***
/////////////////////////////////////////////////////////////////////////////////////////
Indicator "[EAK] Growth rate (Hist.VS Est.)" is designed to display a company's growth rate by comparing historical data with estimates. The configuration options are as follows:
Inputs:
Period: Select the analysis period, such as TTM (Trailing Twelve Months), representing the last 12 months, or FY, which uses last full year data.
Show EPS Growth%: Enables the display of the compound annual growth rate (CAGR) of EPS.
Show Median Growth%: Enables the display of the median of the compound annual growth rate.
Show EPS Estimate by TradingView: Displays EPS estimate data from TradingView. (This retrieves the latest data available in TradingView; therefore, please verify the corresponding fiscal year.)
Position: Sets the indicator's display position on the chart, such as middle_right.
Text Size: Sets the text size of the displayed information, such as normal.
In summary, this indicator provides an overview of a company's earnings growth by comparing historical performance with forecasts, facilitating trend analysis and investment decisions. The various settings allow users to customize the display for their specific needs.
Note:
EPSm = EPS CAGR (Median)
REVm = Revenue CAGR (Median)
OPm = Operating income CAGR (Median)
DIVm = Dividend CAGR (Median)
EQm = Total Equity CAGR (Median)
ASm = Total Asset CAGR (Median)
***This indicator is designed for use on daily (D1) charts only. As it retrieves data by counting back bars, some inaccuracies may occur. For accuracy, please cross-reference the information with reliable sources.
Nota Keluaran
Update 31Jan2025Add FCF Median
ปรับให้การแสดง Est(Q) เป็น Median Target Price
และใช้สีแดงบอกกรณีที่ข้อมูลของEst(FY)เป็นข้อมูลเก่า(หรือสังเกตจาก เป้าหมายที่เป็น NaN)
Skrip dilindungi
Skrip ini diterbitkan sebagai sumber tertutup. Akan tetapi, anda boleh menggunakannya secara bebas dan tanpa apa-apa had – ketahui lebih di sini.
Penafian
Maklumat dan penerbitan adalah tidak bertujuan, dan tidak membentuk, nasihat atau cadangan kewangan, pelaburan, dagangan atau jenis lain yang diberikan atau disahkan oleh TradingView. Baca lebih dalam Terma Penggunaan.