OPEN-SOURCE SCRIPT
Telah dikemas kini Dynamic 4-Hour Candle (Accurate Highs and Lows)
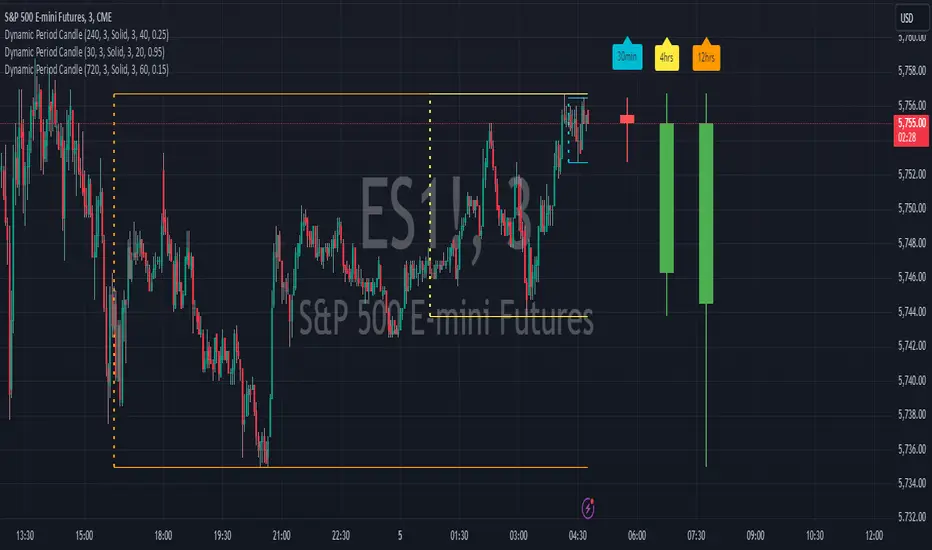
This gives a dynamic 4 hour history of the current price, so that you can assess the current trend. I found lots of indicators that looked at the previous 4 hr candle, but they then immediately switched to the new 4 hr candle when it started to be formed. this indicator looks back at the rolling previous 4 hours.
Nota Keluaran
This is version 2 of this indicator. It allows you to change the look back period and the time frame of the chart that you are using it on. Nota Keluaran
I also think that the candle is more accurate now in its representation of the previous time period specified, but please feel free to improve on this yourselves!Nota Keluaran
added a setting to reposition the indicator on the chartNota Keluaran
I've added a label that you can put above the candle, as it can be useful having a few of these on the chart covering different time frames, and the labels avoid any confusion as to what each candle represents.Nota Keluaran
I've now added a line that you can add on the chart to show where each look back period is. This can be colour coded to match your labels, so you can clearly see which time period is being measured by witch line.Nota Keluaran
Tidied teh label so that it now displays the hours instead of the minutes, if necessary.Nota Keluaran
Added in optional high low lines on the chart for the time period, so you can easily see them if you prefer to have them up on the chart.Skrip sumber terbuka
Dalam semangat TradingView sebenar, pencipta skrip ini telah menjadikannya sumber terbuka, jadi pedagang boleh menilai dan mengesahkan kefungsiannya. Terima kasih kepada penulis! Walaupuan anda boleh menggunakan secara percuma, ingat bahawa penerbitan semula kod ini tertakluk kepada Peraturan Dalaman.
Penafian
Maklumat dan penerbitan adalah tidak bertujuan, dan tidak membentuk, nasihat atau cadangan kewangan, pelaburan, dagangan atau jenis lain yang diberikan atau disahkan oleh TradingView. Baca lebih dalam Terma Penggunaan.
Skrip sumber terbuka
Dalam semangat TradingView sebenar, pencipta skrip ini telah menjadikannya sumber terbuka, jadi pedagang boleh menilai dan mengesahkan kefungsiannya. Terima kasih kepada penulis! Walaupuan anda boleh menggunakan secara percuma, ingat bahawa penerbitan semula kod ini tertakluk kepada Peraturan Dalaman.
Penafian
Maklumat dan penerbitan adalah tidak bertujuan, dan tidak membentuk, nasihat atau cadangan kewangan, pelaburan, dagangan atau jenis lain yang diberikan atau disahkan oleh TradingView. Baca lebih dalam Terma Penggunaan.