OPEN-SOURCE SCRIPT
EMA FAST-SLOW
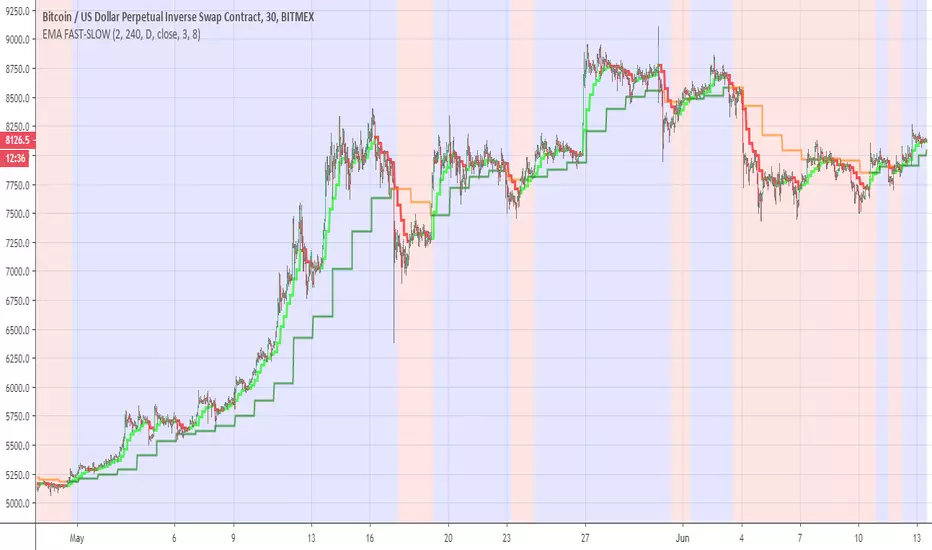
This indicator has the following
ema fast (length 3 and 8 ) based on 240 min
ema slow (length 3 and 8 ) based on daily MTF
The reason for the two length in each EMA is to give us the the insight of shorter trend in larger trend
so the large trend is when ema fast 240 min is above the daily ema slow this is shown in the bullish or bearish zones
the smaler trend for each MTF is shown in different color (lime:red) for ema fast 240 min , and (green:orange) for the slow daily EMA
when we this setting on smaller time frame so it more easy to see where the asset is going this the basic idea
you can change the setting as you wish in oreder to find the best one for your time frame
Skrip sumber terbuka
Dalam semangat TradingView sebenar, pencipta skrip ini telah menjadikannya sumber terbuka, jadi pedagang boleh menilai dan mengesahkan kefungsiannya. Terima kasih kepada penulis! Walaupuan anda boleh menggunakan secara percuma, ingat bahawa penerbitan semula kod ini tertakluk kepada Peraturan Dalaman.
Penafian
Maklumat dan penerbitan adalah tidak bertujuan, dan tidak membentuk, nasihat atau cadangan kewangan, pelaburan, dagangan atau jenis lain yang diberikan atau disahkan oleh TradingView. Baca lebih dalam Terma Penggunaan.