Historical Liquidity
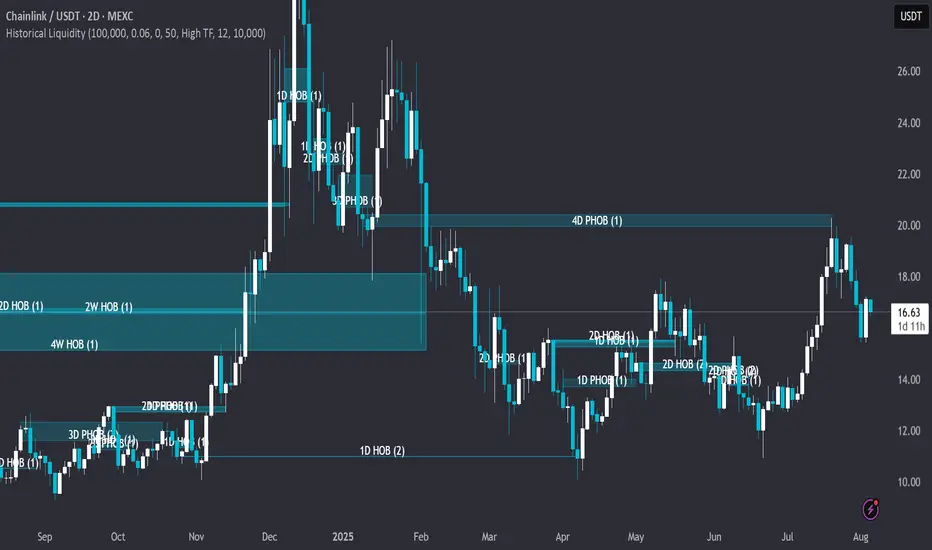
🟠OVERVIEW: Historical Liquidity Indicator This script is a powerful backtesting tool and companion to our "Hidden Liquidity Indicator." It visualizes mitigated liquidity zones that have already been touched by price action. By showing a historical record of these events, it allows traders to systematically analyze past market structure, evaluate the effectiveness of liquidity zones, and refine their mitigation-based trading strategies.
🟠CORE LOGIC: The Connection to Hidden Liquidity The indicator's core logic is built upon the same proprietary methodology as our "Hidden Liquidity Indicator," which focuses on the relationship between Fair Value Gaps (FVGs) and candle bodies. The central idea is to identify institutional footprints—specifically, where hidden order blocks form—before the price revisits and "mitigates" them.
The process involves two main steps:
1. Detection of Liquidity Zones: The script identifies and classifies a liquidity zone based on specific, rule-based criteria:
o Hidden Order Block (HOB): A strong zone where a candle body fits 100% inside a Fair Value Gap, and is untouched by any wicks. For an HOB to be considered valid, its equilibrium (midpoint) must be crossed by the FVG.
o Partial Hidden Order Block (PHOB): A weaker, but still significant, zone where a candle body fits at least 50% inside the FVG.
2. Tracking Mitigation: The indicator then continuously tracks these detected zones. A zone is considered mitigated when a subsequent candle's wick or body touches or enters at least 50% of that zone.
Once a zone is detected and subsequently mitigated according to these rules, the indicator stores this information and visualizes it historically on the chart. This allows traders to see exactly where and how these hidden liquidity zones influenced past price action.
🟠SETTINGS & CUSTOMIZATION The indicator offers extensive customization to adapt to various trading styles and analysis needs.
• General & Candle Settings:
o Show Partial HOB: Toggle the visibility of Partial Hidden Order Blocks (PHOBs).
o Candle back count: Determines the number of historical bars to be analyzed.
o BB Deviation / BB Min Size Perc: These settings allow for fine-tuning the underlying volatility calculation, which helps in identifying the specific conditions for HOB formation.
o Partial Min Size in FVG Perc: Customizes the percentage (default 50%) required for a candle body to be considered a PHOB.
• Multi-Timeframe (MTF) Analysis: The indicator can check for liquidity zones on different timeframes. Users can select from pre-defined Low, Mid, or High Timeframe sets, or customize which specific timeframes are checked for analysis (e.g., 5m, 15m, 1h, 4h, 1D).
• Color & Visualization:
o HOBs and PHOBs: Users can customize the distinct colors for each type of liquidity zone.
o Box Border: Option to display or hide the border around the detected zones.
o Labels: Customize the color and text size of the labels describing each zone.
🟠PURPOSE & USAGE This indicator is specifically designed for systematic backtesting and strategic development. It is not intended to provide live trading signals. Its value lies in:
• Quantifying Success: It enables traders to measure the success rate of different HOB types across various timeframes and market conditions.
• Post-Mitigation Analysis: Users can analyze price behavior after a mitigation event, e.g., whether it led to continuation, reversal, or a retest.
• Identifying Support/Resistance: It helps to identify historical support and resistance levels that were formed by previously respected liquidity blocks, offering a data-driven alternative to traditional S/R methods.
🟠WHY IT MATTERS This indicator transforms subjective order block analysis into an objective, data-driven process. By providing a clear, visual history of which liquidity zones were actually respected or invalidated by the market, it empowers traders to build and validate their strategies on a foundation of empirical evidence rather than on intuition alone.
Skrip jemputan sahaja
Hanya pengguna disahkan oleh penulis boleh mengakses skrip ini. Anda perlu memohon dan mendapatkan kebenaran untuk menggunakannya. Keizinan selalunya diberikan selepas pembayaran. Untuk lebih butiran, ikuti arahan penulis di bawah atau hubungi HiddenLiquidty secara terus.
TradingView TIDAK menyarankan pembayaran atau penggunaan skrip kecuali anda mempercayai sepenuhnya penulis dan memahami bagaimana ia berfungsi. Anda juga boleh menjumpai alternatif sumber terbuka dan percuma yang lain di dalam skrip komuniti kami.
Arahan penulis
Penafian
Skrip jemputan sahaja
Hanya pengguna disahkan oleh penulis boleh mengakses skrip ini. Anda perlu memohon dan mendapatkan kebenaran untuk menggunakannya. Keizinan selalunya diberikan selepas pembayaran. Untuk lebih butiran, ikuti arahan penulis di bawah atau hubungi HiddenLiquidty secara terus.
TradingView TIDAK menyarankan pembayaran atau penggunaan skrip kecuali anda mempercayai sepenuhnya penulis dan memahami bagaimana ia berfungsi. Anda juga boleh menjumpai alternatif sumber terbuka dan percuma yang lain di dalam skrip komuniti kami.