PROTECTED SOURCE SCRIPT
Statistical AMD
Overview
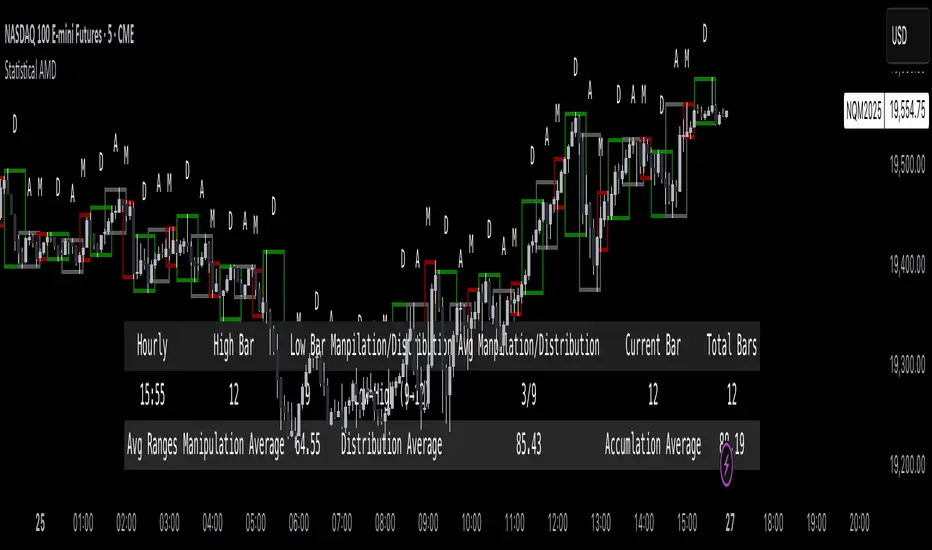
The Statistical AMD ("Accumulation, Manipulation, Distribution") is a real-time statistical analyzer and visual segmentation tool for price action.
It identifies and tracks the structure of major movements within higher timeframe candles — breaking them into three key phases:
Manipulation (M): Early-stage liquidity sweeps.
Distribution (D): Mid-phase trending moves.
Accumulation (A): Late-stage compression zones.
The tool records and visualizes where highs and lows form relative to the open of a larger candle (e.g., 1-hour) and aggregates statistical behavior across sessions.
This is not a predictive indicator — it is a segmentation and statistical probability builder for real-time and historical analysis.
What It Does
Tracks High/Low Timing:
Identifies when the high and low occur during each higher timeframe candle (like hourly).
Plots Box Structures:
Color-coded boxes for each phase:
Red = Manipulation
Green = Distribution
White = Accumulation
Displays Statistical Table:
Average timing of highs and lows
Current vs historical bar position tracking
Average ranges for each phase
Historical Aggregation:
Aggregates hundreds of candles' data to build probabilistic expectations.
Live Updates:
Boxes dynamically expand as price evolves within each phase.
Key Settings
HTF Reference:
Select the higher timeframe to analyze (Default: 1 Hour).
Manually Input Legs:
Customize leg sizes for manipulation, distribution, and no-trade zones.
Defaults:
Manipulation Leg = 3 bars
Distribution Leg = 6 bars
No Trade Zone = 6 bars
Ideal For
Liquidity and Manipulation Traders:
Those analyzing sweep behaviors, fakeouts, and structural rotations.
Time-based Statistical Analysts:
Users who build mean-reversion or breakout models based on timing patterns.
ICT, Smart Money Concept (SMC) Traders:
Traders who track sweep → displacement → compression cycles.
Scalpers and Intraday Traders:
Anyone needing microstructural framing inside large candles.
Important Notes
Higher timeframe anchoring is critical.
Make sure you align the "HTF Reference" with your intended analysis frame (e.g., if you scalp on 1-min, set HTF to 1H or 4H).
The tool doesn’t predict future moves directly — it helps build a contextual, statistically-backed map of where you are inside the cycle.
Manual input flexibility allows tailoring for different asset volatility.
Final Thought
If you're trading without understanding the internal phases of a candle — you're navigating blind.
Statistical AMD arms you with objective, historical data about how and when price tends to expand, manipulate, and compress — so you can act with probability on your side.
Skrip dilindungi
Skrip ini diterbitkan sebagai sumber tertutup. Akan tetapi, anda boleh menggunakannya secara bebas dan tanpa apa-apa had – ketahui lebih di sini.
Penafian
Maklumat dan penerbitan adalah tidak bertujuan, dan tidak membentuk, nasihat atau cadangan kewangan, pelaburan, dagangan atau jenis lain yang diberikan atau disahkan oleh TradingView. Baca lebih dalam Terma Penggunaan.