PROTECTED SOURCE SCRIPT
Telah dikemas kini Gann Square of 9 cardinal cross and trines
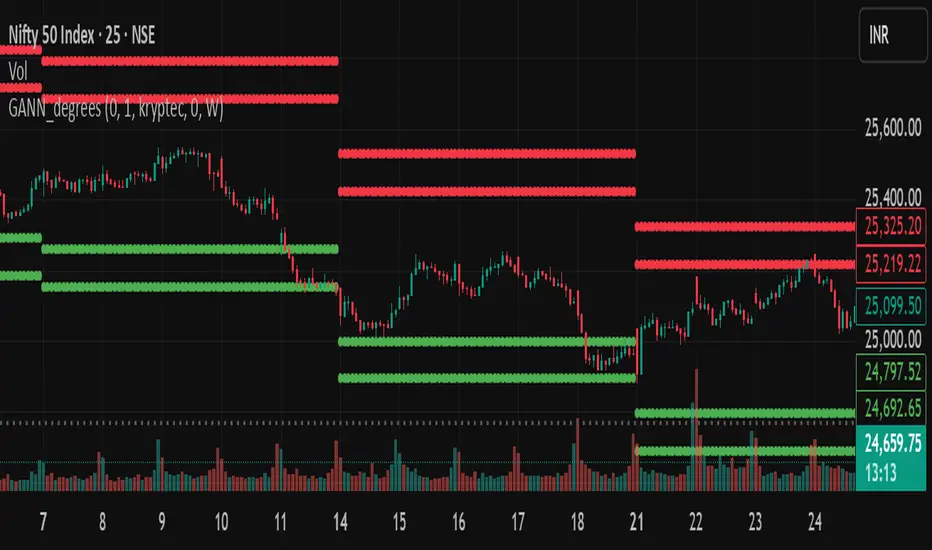
Gann Square of 9
This indicator is a powerful tool for traders who use W.D. Gann's methodologies to forecast potential support and resistance levels. It visualizes key price levels derived from the Gann Square of 9, a classic tool in technical analysis that relates price and time through geometric angles and rotations.
How It Works
The Gann Square of 9 is a spiral number chart where price moves in a clockwise spiral. Key angles on this square (such as 90°, 180°, 270°, and 360°) are used to identify price levels that act as magnets for future price action. This indicator automates that process by calculating these levels dynamically from a chosen pivot point.
Key Features
This script provides comprehensive and customizable functionality, including several unique enhancements:
Customizable Pivot Point: Choose your pivot price source from various options, including open, high, low, close, hl2, hlc3, ohlc4, and kryptec.
Dynamic Pivot Updates: The indicator can automatically reset its pivot price at the beginning of a new period (e.g., a new day, week, or month), allowing the levels to adapt to recent market changes.
Fixed Pivot Option: To prevent the indicator from changing when you scroll through historical data, you can choose to use a fixed pivot price. This anchors the levels to a specific value, ensuring they remain constant regardless of the visible chart range.
Extended Gann Angles: In addition to the traditional 90°, 180°, and 270° levels, this script also includes the 120° and 240° angles for more granular analysis of potential turning points.
Multiplier and Rotations: Fine-tune the distance between the Gann levels with the multiplier input. The rotations parameter allows you to raise or lower the entire set of levels by one or more 360° rotations, adapting the indicator to different price ranges.
How to Use
Choose Your Pivot: The indicator's levels are all based on a single pivot price.
For a static analysis, enable "Use Fixed Pivot Price?" and enter a specific price you want to anchor your analysis to.
For a dynamic analysis, select your desired "Resolution" (e.g., 'W' for weekly) and the pivot price will be set based on the previous period's data.
Adjust Rotations: Use the rotations input to shift the entire set of levels up or down until they align with a significant support or resistance area on your chart.
Analyze Levels: The plotted lines represent potential support and resistance zones. A price move through one level may target the next one in the sequence.
Disclaimer: This indicator is a tool for technical analysis and should not be considered financial advice. Past performance of these levels does not guarantee future results. Always use proper risk management and conduct your own research before making any trading decisions.
Nota Keluaran
changed the multiplier settingsSkrip dilindungi
Skrip ini diterbitkan sebagai sumber tertutup. Akan tetapi, anda boleh menggunakannya secara bebas dan tanpa apa-apa had – ketahui lebih di sini.
Penafian
Maklumat dan penerbitan adalah tidak bertujuan, dan tidak membentuk, nasihat atau cadangan kewangan, pelaburan, dagangan atau jenis lain yang diberikan atau disahkan oleh TradingView. Baca lebih dalam Terma Penggunaan.
Skrip dilindungi
Skrip ini diterbitkan sebagai sumber tertutup. Akan tetapi, anda boleh menggunakannya secara bebas dan tanpa apa-apa had – ketahui lebih di sini.
Penafian
Maklumat dan penerbitan adalah tidak bertujuan, dan tidak membentuk, nasihat atau cadangan kewangan, pelaburan, dagangan atau jenis lain yang diberikan atau disahkan oleh TradingView. Baca lebih dalam Terma Penggunaan.