OPEN-SOURCE SCRIPT
Telah dikemas kini High Volume Price Levels x3
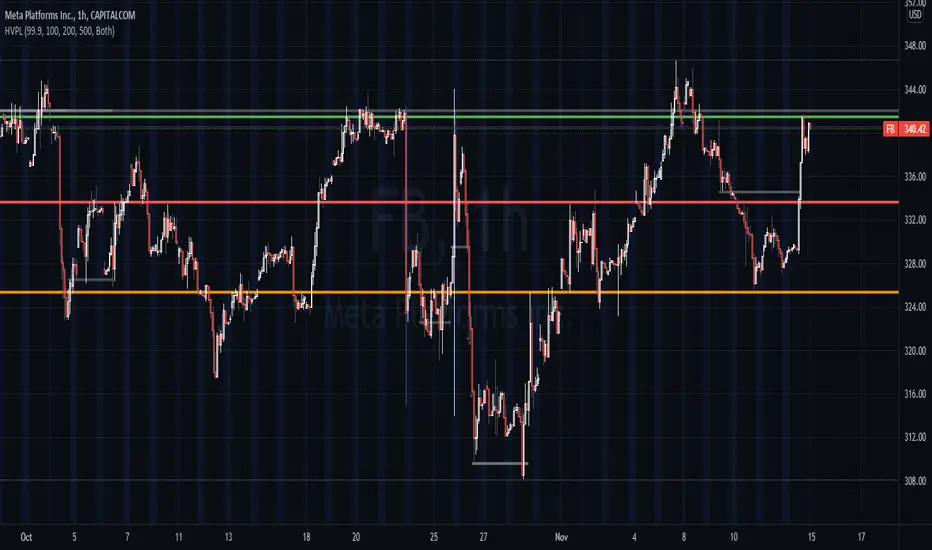
This script detects recent huge volume areas to help you finding out good support and resistance levels.
For each of the3 periods (defaults : 100, 200, 500) a new line will be drawn from the last time the volume amount exceeded n% (default 99%) of the highest volume on the same period, to the next occurence.
Most of time, these lines represent strong support and resistance levels which can be helpful in your technical analysis.
Options:
Notes:
* Sometimes, the last detected level from every periods can be the same at the same moment. In this situation, you'll only see one or two of the lines instead of three.
* I'd like to figure out how to continuously draw every interesting levels without making the chart unreadable. Of course this script will be updated if I find a good way to do it.
* Feel free to suggest any improvements/modifications.
Example:

For each of the3 periods (defaults : 100, 200, 500) a new line will be drawn from the last time the volume amount exceeded n% (default 99%) of the highest volume on the same period, to the next occurence.
Most of time, these lines represent strong support and resistance levels which can be helpful in your technical analysis.
Options:
- Volume trigger level: represents the minimum % of the highest volume within the given period on which you want to draw a new price level. (But higher this % is, stronger the levels will be)
- Periods: The reference periods for high volume detection.
- Show period: Enable/Disable the use of any period.
- Period Color: Select a color correspondig to each period.
- Show current levels only: Disable drawing of previous levels, to display current levels only.
- Extend last level: Extend current lines to right/left/both or none sides of your chart.
Notes:
* Sometimes, the last detected level from every periods can be the same at the same moment. In this situation, you'll only see one or two of the lines instead of three.
* I'd like to figure out how to continuously draw every interesting levels without making the chart unreadable. Of course this script will be updated if I find a good way to do it.
* Feel free to suggest any improvements/modifications.
Example:
Nota Keluaran
Demo chart updated. Previous levels drawnNota Keluaran
- Corrected mistyped short title
- A "Ghost lines" option that extend 3rd period price lines has been added (activated by default)
- Previous levels are now colored in gray
Nota Keluaran
Fix wrong operator in the previous update 1min (ago)Nota Keluaran
fix: old lines corresponding to 3rd price level still in red instead of gray when ghost lines are disabledNota Keluaran
fix: tiny display bug for period1 linefix: removing useless empty lines
fix: any line width is now fixed to 3
Skrip sumber terbuka
Dalam semangat TradingView sebenar, pencipta skrip ini telah menjadikannya sumber terbuka, jadi pedagang boleh menilai dan mengesahkan kefungsiannya. Terima kasih kepada penulis! Walaupuan anda boleh menggunakan secara percuma, ingat bahawa penerbitan semula kod ini tertakluk kepada Peraturan Dalaman.
Penafian
Maklumat dan penerbitan adalah tidak bertujuan, dan tidak membentuk, nasihat atau cadangan kewangan, pelaburan, dagangan atau jenis lain yang diberikan atau disahkan oleh TradingView. Baca lebih dalam Terma Penggunaan.