OPEN-SOURCE SCRIPT
Telah dikemas kini Linear Regression 200/100/50/20
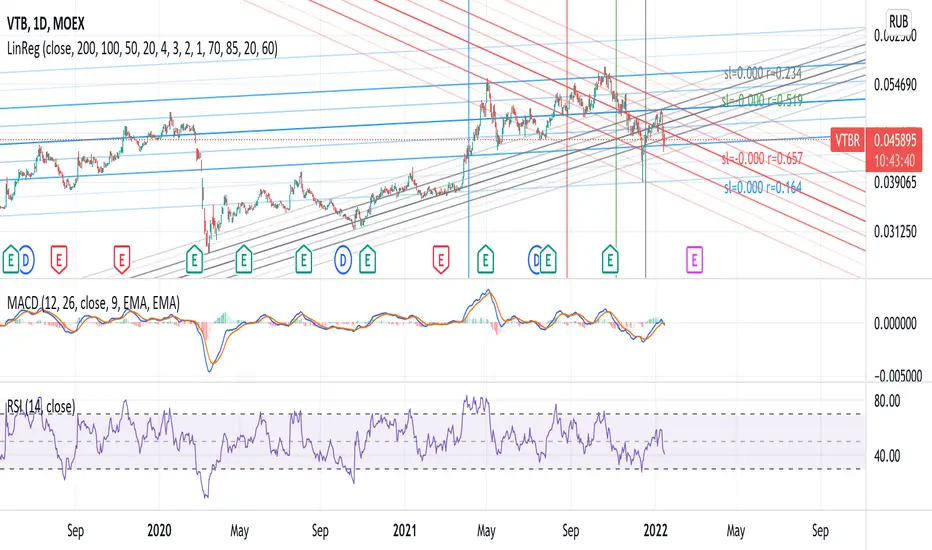
Four time frames in one indicator in different colors, showing current price trend in different scopes.
If the slope of the smaller time frame is in a (0,75;1,25) interval of some of the bigger ones the smaller one is omitted (different signs near zero are not coalesced in that way though).
Every time frame has four deltas of range in trend lines of different grade of transparency (2-1-4-3), as well as a vertical line denoting regression date range start, also bearing the same color (blue-red-green-gray for 200/100/50/20).
On the right of the latest bar are Pearson coefficients and slopes of the regressions, 200/100/50/20 bottom-up, also appropriately colored.
Nota Keluaran
Some of the trends can now be disabled in the config.Parameter layout fixes.
Nota Keluaran
Label format fix.Nota Keluaran
Added exponential scale support, should be selected manually in the config.Minor fixes
Nota Keluaran
Minor fix.Skrip sumber terbuka
Dalam semangat TradingView sebenar, pencipta skrip ini telah menjadikannya sumber terbuka, jadi pedagang boleh menilai dan mengesahkan kefungsiannya. Terima kasih kepada penulis! Walaupuan anda boleh menggunakan secara percuma, ingat bahawa penerbitan semula kod ini tertakluk kepada Peraturan Dalaman.
Penafian
Maklumat dan penerbitan adalah tidak bertujuan, dan tidak membentuk, nasihat atau cadangan kewangan, pelaburan, dagangan atau jenis lain yang diberikan atau disahkan oleh TradingView. Baca lebih dalam Terma Penggunaan.
Skrip sumber terbuka
Dalam semangat TradingView sebenar, pencipta skrip ini telah menjadikannya sumber terbuka, jadi pedagang boleh menilai dan mengesahkan kefungsiannya. Terima kasih kepada penulis! Walaupuan anda boleh menggunakan secara percuma, ingat bahawa penerbitan semula kod ini tertakluk kepada Peraturan Dalaman.
Penafian
Maklumat dan penerbitan adalah tidak bertujuan, dan tidak membentuk, nasihat atau cadangan kewangan, pelaburan, dagangan atau jenis lain yang diberikan atau disahkan oleh TradingView. Baca lebih dalam Terma Penggunaan.