@InvInst - ZG
📊 OVERVIEW
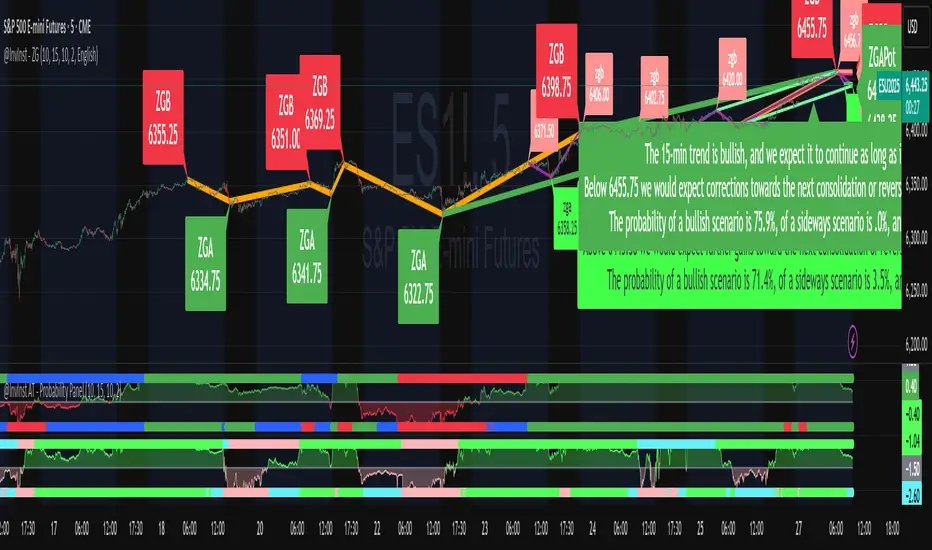
The ZG Indicator is a comprehensive tool for identifying Reversal Zones (ZG) across any timeframe and asset. Designed to support objective trend analysis, it does not depend on adjustable parameters for each asset and assists in discerning potential trend shifts and dynamic Fibonacci retracements without subjective user bias. It is most effective when used alongside the AT Indicator, which provides complementary insights by evaluating both current and future trends through probability-based calculations of bullish, sideways, or bearish outcomes. The accompanying chart demonstrates the ZG Indicator overlaid on price data.
📊 VALUE OF THE INDICATOR…
No matter if you are a discretionary or a systematic trader, the result of this approach is game changer, since ensuring a single valid interpretation of asset trends, supported by key price and time points (ZG), (1) is crucial for robust analysis; (2) minimizes degrees of freedom for machine learning or AI algorithms applied to market data; (3) helps separate order from noise/chaos in a fully consistent and internally coherent manner.
For discretionary traders, having a single valid interpretation of a trend (1) minimizes emotional fatigue caused by constant reinterpretation and subjective data selection, (2) establishes a foundation for objective pattern recognition, and (3) provides a layer of information such as the real time probability that perfectly complements any other indicator or approach.
📊 FIRST THINGS FIRST: A BIT OF THEORY…
Definition of ZG
A ZG signifies a consolidation or inflection point where the previous directional move might conclude. These formations are instrumental in the trend analysis of any asset, irrespective of the asset or timeframe. Formally, we define ZG_tf = (timestamp_zg, price_zg), indicating a ZG is represented as a pair consisting of its timestamp and price within a specified timeframe.
Types of ZGs
We categorize ZGs based on their directional implications:
✅ Bullish Reversal Zone (ZGA) – Regions where prices may rebound upward or consolidate following a downtrend.
✅ Bearish Reversal Zone (ZGB) – Regions where prices may reverse downward after an uptrend.
Furthermore, three distinct statuses are assigned to each ZG:
• Potential ZGs (ZGAPot and ZGBPot on the chart) – Zones anticipated to develop in the future, aiding in forecasting potential future trends.
• Current or Last Identified ZGs – The latest reversal zones detected for each timeframe.
• Confirmed ZGs – Validated zones that serve as static reference points delineating historical trends unequivocally.
📊 FUNCTIONALITY: WHAT IT DOES…
The ZG indicator is meant to be analyze objectively the trend of any asset. In order to do that, it needs to find the inflexion points in the time series that form the zig-zag shape of the trend. The ZG Indicator promptly identifies new ZGs without delay, illustrating both confirmed and identified ZGs, along with ranges for future Potential ZGs. Red labels indicate either confirmed or identified ZGBs, whereas green labels denote confirmed and identified ZGAs. The right side of the chart reveals the price ranges where future ZGs might materialize.
The indicator synthesizes data from two timeframes—the chart's timeframe and a larger one selected by the user—enabling a contextual comprehension of the asset's trend. Differentiated colors and labeling styles facilitate clear interpretation of the asset’s status.
Trigger levels altering the current trend…
Additionally, the ZG Indicator highlights trigger prices with dashed blue lines, signifying potential shifts in the trend for each selected timeframe in case they are passed.
Dynamic Fibonacci retracements utilized objectively and systematically…
The ZG Indicator leverages ZGAs and ZGBs to compute Fibonacci retracement areas (38.2%-61.8%) objectively for each timeframe, eliminating subjective selection of highs and lows typically seen in trading practices. Different colors help the user identify whether the Fibonacci retracements correspond to upward movements or downward movements.
Objective commentary interpreting the trend…
The trend analysis based on ZGs is entirely mathematical/objective, permitting only one valid interpretation. Users can enable comments, available in English or Spanish, detailing the current trend, trigger levels for trend changes, prospective ZG formation ranges, and the probability for each trend scenario of the last available candle.
📊 KEY FEATURES: HOW IT DOES IT…
The identification of either ZGA or ZGB -pivot points in a typically zig-zag shaped trend-, and future ZGAs and ZGBs relies on three foundational principles:
✅ Historical behavior... is examined to recognize price conditions that have usually met repeatedly in the past.
✅ Temporal dislocation... between trends of different magnitudes —such as short-term exhaustion within a still-intact longer-term trend— which often precedes a shift in market direction.
✅ Balance or imbalance between buying and selling pressure... when one side begins to weaken noticeably, it can signal an impending change in control, thereby increasing the likelihood of a reversal.
It uses the 4-ZG theorem, mathematically proven, in order to determine the trigger points that would unequivocally provoke a shift of the current trend into something different, as well as for the calculation of the probability attributable to each trend scenario —either bullish, sideways or bearish for each candle—, providing a real-time outcome as a readable comment that the user can leverage on to understand the strength of the trend.
The ZG Indicator is 100% original, as it uses our own proprietary algorithms protected by international intellectual property laws, devoid of public domain code. It operates independently of changeable parameters for individual assets. Key features include:
🔹100% Objective Approach for the identification of ZGs based on mathematical equation systems.
🔹No Repainting – Use of available information at the time, avoiding reinterpretation of past data.
🔹Early Detection – Since it is a price action indicator, there is no delay in the identification of new ZG. The use of highs and lows, instead of ZGs have practical limitations and lagging effects that can also be avoided with ZGs.
🔹Dual Timeframe Analysis – Integrates smaller and larger timeframes for enhanced trend context.
🔹Based on Trend Definition – higher ZGBs and higher ZGAs for bullish trend, lower ZGBs and lower ZGAs for bearish, and all other cases classified as sideways trend.
📊 HOW TO USE IT…
The user has only to read the comments provided for each timeframe to understand all the information provided by this indicator. The ZG Indicator is 100% self-explanatory, its outcome is directly usable, as it provides an objective interpretation as an unequivocal comment that any trader can understand and use right away. It is important to note that it only represents half of our comprehensive trend analysis, since our AT Indicator complements and augments the ZG Indicator's insights, providing the distribution of the probability assigned to bullish, sideways, and bearish trends over time, along with real-time assessments of current and future trends based on ZGs and potential ZGs. The combination of both indicators is recommended.
📊 AVAILABLE SETTINGS
The ZG Indicator offers a comprehensive settings window for full control of displayed information:
🔹 Number of ZGs for smaller timeframes (optimizable for TradingView performance)
🔹 Customizable colors for smaller timeframe ZG lines
🔹 Enable/Disable Fibonacci retracements for smaller timeframes
🔹 Larger Timeframe Selection (options vary per TradingView plan)
🔹 Number of ZGs for larger timeframes (optimizable for TradingView performance)
🔹 Customizable colors for larger timeframe ZG lines
🔹 Enable/Disable Fibonacci retracements for larger timeframes
🔹 Enable/Disable Lines Connecting ZGs
🔹 Activate/Deactivate Trigger Conditions for Trend Shifts (blue dashed lines indicating shift levels for each timeframe)
🔹 Show Trend Comment per Timeframe (only one correct interpretation due to 100% objective methodology)
🔹 Select Trend Comment Language (English or Spanish)
📊 ADDITIONAL CONSIDERATIONS
The ZG Indicator represents half of a comprehensive trend analysis. Our AT Indicator complements and augments the ZG Indicator's insights, providing the distribution of the probability assigned to bullish, sideways, and bearish trends, along with real-time assessments of current and future trends based on ZGs and potential ZGs. The combination of both indicators is recommended.
Recommended timeframe combinations:
🔹 1-minute and 5-minutes - Suitable for scalpers
🔹 5-minutes and 15-minutes - Ideal for scalping and fine-tuning swing trades
🔹 1-hour and 4-hours - Beneficial for swing traders and long-term position adjustments
🔹 1-day and 1-week - Optimal for long-term investors
⚠️ Disclaimer: This indicator does not generate buy or sell signals. It is advised to use it alongside the AT Indicator and integrate it with additional technical analysis tools and risk management strategies.
Skrip jemputan sahaja
Hanya pengguna disahkan oleh penulis boleh mengakses skrip ini. Anda perlu memohon dan mendapatkan kebenaran untuk menggunakannya. Keizinan selalunya diberikan selepas pembayaran. Untuk lebih butiran, ikuti arahan penulis di bawah atau hubungi Inversores_Institucionales secara terus.
TradingView TIDAK menyarankan pembayaran atau penggunaan skrip kecuali anda mempercayai sepenuhnya penulis dan memahami bagaimana ia berfungsi. Anda juga boleh menjumpai alternatif sumber terbuka dan percuma yang lain di dalam skrip komuniti kami.
Arahan penulis
Penafian
Skrip jemputan sahaja
Hanya pengguna disahkan oleh penulis boleh mengakses skrip ini. Anda perlu memohon dan mendapatkan kebenaran untuk menggunakannya. Keizinan selalunya diberikan selepas pembayaran. Untuk lebih butiran, ikuti arahan penulis di bawah atau hubungi Inversores_Institucionales secara terus.
TradingView TIDAK menyarankan pembayaran atau penggunaan skrip kecuali anda mempercayai sepenuhnya penulis dan memahami bagaimana ia berfungsi. Anda juga boleh menjumpai alternatif sumber terbuka dan percuma yang lain di dalam skrip komuniti kami.