OPEN-SOURCE SCRIPT
Telah dikemas kini Greer Value Yields Line

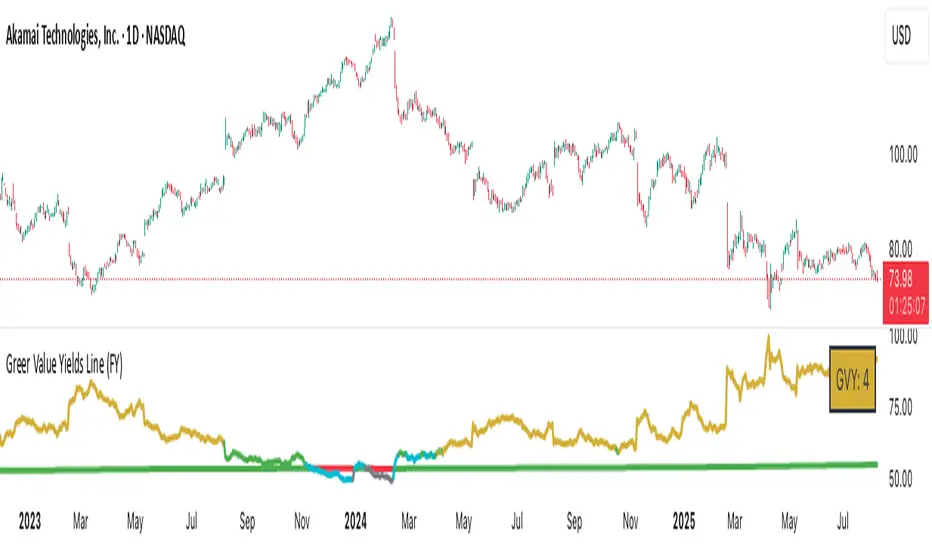
📈 Greer Value Yields Line – Valuation Signal Without the Clutter
Part of the Greer Financial Toolkit, this streamlined indicator tracks four valuation-based yield metrics and presents them clearly via the Data Window, GVY Score badge, and an optional Yield Table:
Earnings Yield (EPS ÷ Price)
FCF Yield (Free Cash Flow ÷ Price)
Revenue Yield (Revenue per Share ÷ Price)
Book Value Yield (Book Value per Share ÷ Price)
✅ Each yield is compared against its historical average
✅ A point is scored for each metric above average (0–4 total)
✅ Color-coded GVY Score badge highlights valuation strength
✅ Yield trend-lines Totals (TVAVG & TVPCT) help assess direction
✅ Clean layout: no chart clutter – just actionable insights
🧮 GVY Score Color Coding (0–4):
⬜ 0 = None (White)
⬜ 1 = Weak (Gray)
🟦 2 = Neutral (Aqua)
🟩 3 = Strong (Green)
🟨 4 = Gold Exceptional (All metrics above average)
Total Value Average Line Color Coding:
🟥 Red – Average trending down
🟩 Green – Average trending up
Ideal for long-term investors focused on fundamental valuation, not short-term noise.
Enable the table and badge for a compact yield dashboard — or keep it minimal with just the Data Window and trend-lines.
Nota Keluaran
Adjusted Gold hue to a richer, more authentic tone—reduced the overly yellow tint that could be misread as a caution signal.Nota Keluaran
*Fixed the Chart.Adjusted Gold hue to a richer, more authentic tone—reduced the overly yellow tint that could be misread as a caution signal.
Added the ability to toggle between Fiscal Year (FY) and Fiscal Quarter (FQ) views—now you can analyze quarterly data as well as annual metrics for greater flexibility.
Skrip sumber terbuka
Dalam semangat TradingView sebenar, pencipta skrip ini telah menjadikannya sumber terbuka, jadi pedagang boleh menilai dan mengesahkan kefungsiannya. Terima kasih kepada penulis! Walaupuan anda boleh menggunakan secara percuma, ingat bahawa penerbitan semula kod ini tertakluk kepada Peraturan Dalaman.
Penafian
Maklumat dan penerbitan adalah tidak bertujuan, dan tidak membentuk, nasihat atau cadangan kewangan, pelaburan, dagangan atau jenis lain yang diberikan atau disahkan oleh TradingView. Baca lebih dalam Terma Penggunaan.