PROTECTED SOURCE SCRIPT
Telah dikemas kini PVA Volume
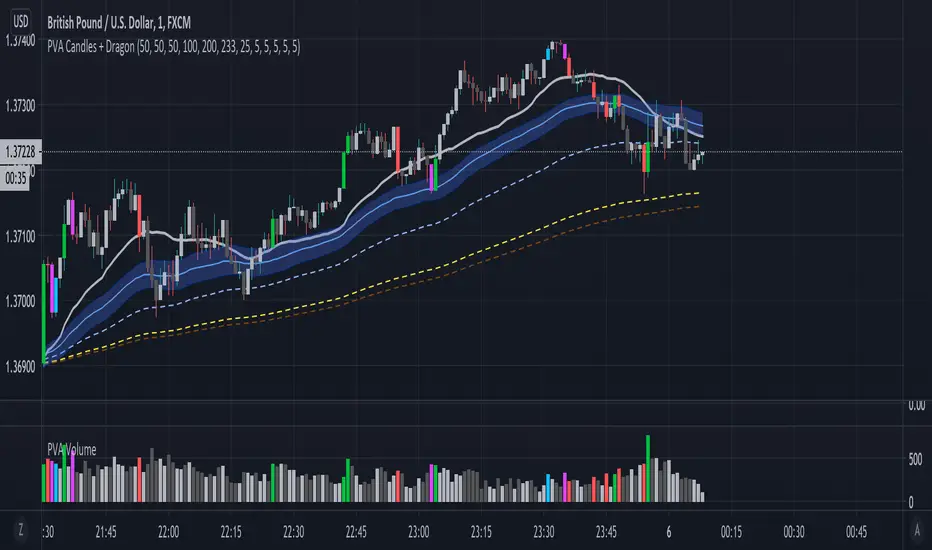
The PVA volume is part of PVSRA and it shows different bar colors according to the conditions below.
Situation "Climax". When volume >= 200% of the average volume of the 10
previous chart candles or where the product of candle spread x candle volume is >= the
highest for the 10 previous chart candles. Default Colors: Bullish bars are green and
Bearish bars are red.
Situation "Volume Rising Above Average". When volume >= 150% of the average
volume of the 10 previous chart candles. Default Colors: Bullish bars are blue and bearish bars are
blue-violet.
Nota Keluaran
I changed the transparency to zero so that the volume bar becomes more visible and so that it resembles the original PVSRA script.Skrip dilindungi
Skrip ini diterbitkan sebagai sumber tertutup. Akan tetapi, anda boleh menggunakannya secara bebas dan tanpa apa-apa had – ketahui lebih di sini.
Penafian
Maklumat dan penerbitan adalah tidak bertujuan, dan tidak membentuk, nasihat atau cadangan kewangan, pelaburan, dagangan atau jenis lain yang diberikan atau disahkan oleh TradingView. Baca lebih dalam Terma Penggunaan.
Skrip dilindungi
Skrip ini diterbitkan sebagai sumber tertutup. Akan tetapi, anda boleh menggunakannya secara bebas dan tanpa apa-apa had – ketahui lebih di sini.
Penafian
Maklumat dan penerbitan adalah tidak bertujuan, dan tidak membentuk, nasihat atau cadangan kewangan, pelaburan, dagangan atau jenis lain yang diberikan atau disahkan oleh TradingView. Baca lebih dalam Terma Penggunaan.