OPEN-SOURCE SCRIPT
RSI Fractal Energy with Signal Line
Here is my second script.
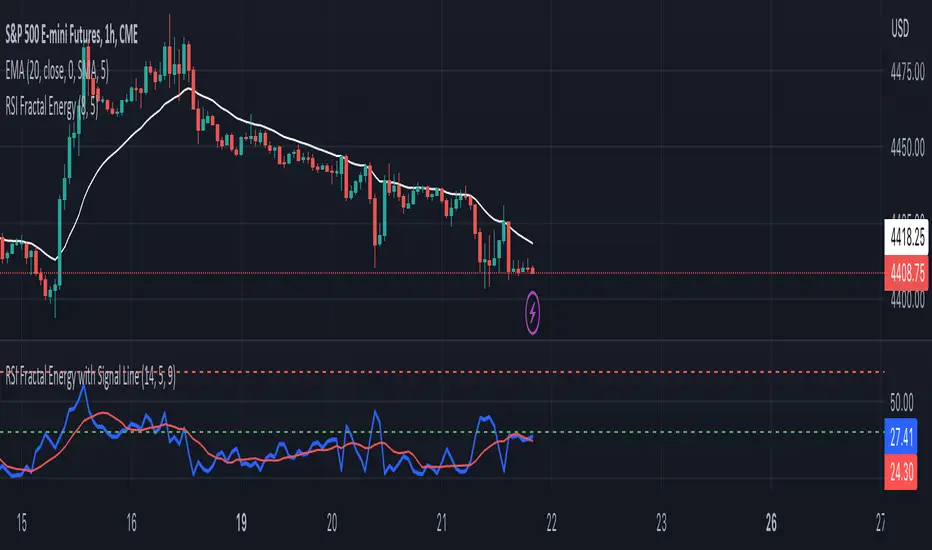
Introducing the RSI Fractal Energy Indicator.
This incorporates the Relative-Strength Index and Fractal Energy as the name implies.
This will help the trader identify:
1. Trend Strength: The higher the value of the indicator can indicate the strength of the trend and vice versa.
2. Reversal points: If the indicator is showing weakness and the market is making higher highs and lower lows this can indicate a reversal is possible.
3. Overbought and Oversold conditions: This indicator is currently set to 30(Oversold) and 70(Overbought), but this can be changed in the source code.
I also added a signal line to provide bullish/bearish crossovers.
I use this indicator on the 1 hr chart, but it can be used on any time frame.
Please let me know if you have any questions, comments, or concerns. Always open to learning more.
I will also provide updates as I continue to use my indicators.
Happy trading!
Skrip sumber terbuka
Dalam semangat TradingView sebenar, pencipta skrip ini telah menjadikannya sumber terbuka, jadi pedagang boleh menilai dan mengesahkan kefungsiannya. Terima kasih kepada penulis! Walaupuan anda boleh menggunakan secara percuma, ingat bahawa penerbitan semula kod ini tertakluk kepada Peraturan Dalaman.
Penafian
Maklumat dan penerbitan adalah tidak bertujuan, dan tidak membentuk, nasihat atau cadangan kewangan, pelaburan, dagangan atau jenis lain yang diberikan atau disahkan oleh TradingView. Baca lebih dalam Terma Penggunaan.