OPEN-SOURCE SCRIPT
Telah dikemas kini Market Open - Relative Volume

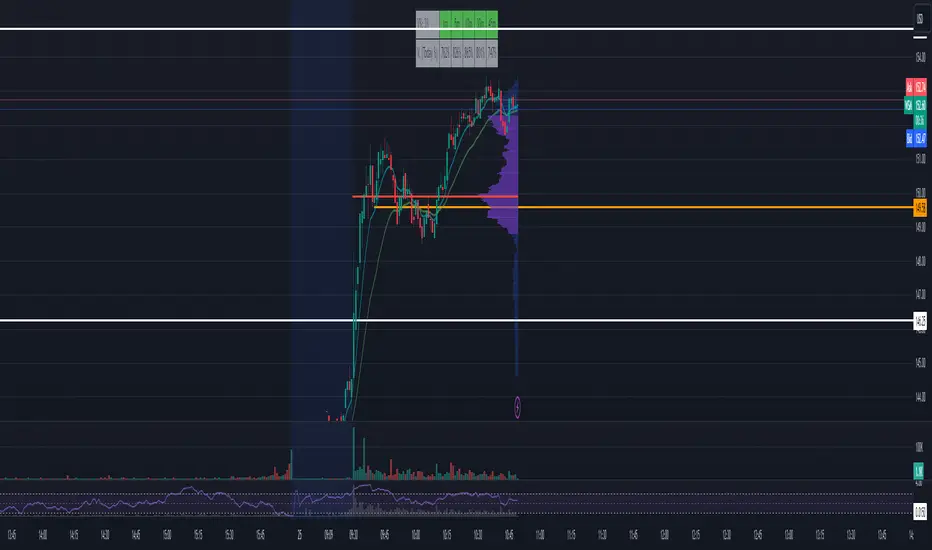
The indicator calculates the Pre-market volume percentage of the current day, relative to the average volume being traded in the trading session (14 days), displayed in Table Row 1, Table Cell 1, as V%. Pre-market volume between 15% & 30% has a orange background color. Pre-market volume percentage above 30% has a green background color.
The indicator calculates the relative volume per candle relative to the average volume being traded in that time period (14 days) (e.g., "1M," "2M," up to "5M"), displayed in a table. Relative volume between 250% & 350% has a orange background color. Relative volume above 350% has a green background color.
FYI >> Indicator calculations are per candle, not time unit (due to pine script restrictions). Meaning, the indicator current table data is only accurate in the 1M chart. If you are using the indicator in a higher timeframe, e.g., on the 5M chart, then the values in table cells >> (1M value == relative volume of the first 5-minute candle) (5M value = relative volume of the first five 5-minute candles) and so on. (Future versions will have a dynamic table).
Nota Keluaran
The indicator calculates the Pre-market volume percentage of the current day, relative to the average volume being traded in the trading session (14 days), displayed in Table Row 1, Table Cell 1, as V%. Pre-market volume between 15% & 30% has a orange background color. Pre-market volume percentage above 30% has a green background color.The indicator calculates the relative volume per candle relative to the average volume being traded in that time period (14 days) (e.g., "1M," "2M," up to "5M"), displayed in a table. Relative volume between 250% & 350% has a orange background color. Relative volume above 350% has a green background color.
FYI >> Indicator calculations are per candle, not time unit (due to pine script restrictions). Meaning, the indicator current table data is only accurate in the 1M chart. If you are using the indicator in a higher timeframe, e.g., on the 5M chart, then the values in table cells >> (1M value == relative volume of the first 5-minute candle) (5M value = relative volume of the first five 5-minute candles) and so on. (Future versions will have a dynamic table).
Skrip sumber terbuka
Dalam semangat TradingView sebenar, pencipta skrip ini telah menjadikannya sumber terbuka, jadi pedagang boleh menilai dan mengesahkan kefungsiannya. Terima kasih kepada penulis! Walaupuan anda boleh menggunakan secara percuma, ingat bahawa penerbitan semula kod ini tertakluk kepada Peraturan Dalaman.
Penafian
Maklumat dan penerbitan adalah tidak bertujuan, dan tidak membentuk, nasihat atau cadangan kewangan, pelaburan, dagangan atau jenis lain yang diberikan atau disahkan oleh TradingView. Baca lebih dalam Terma Penggunaan.