OPEN-SOURCE SCRIPT
Telah dikemas kini [blackcat] L1 volume Oscillator Indicator
Level: 1
Background
Omega Research proposed volume oscillator indicator in June 2000.
Function
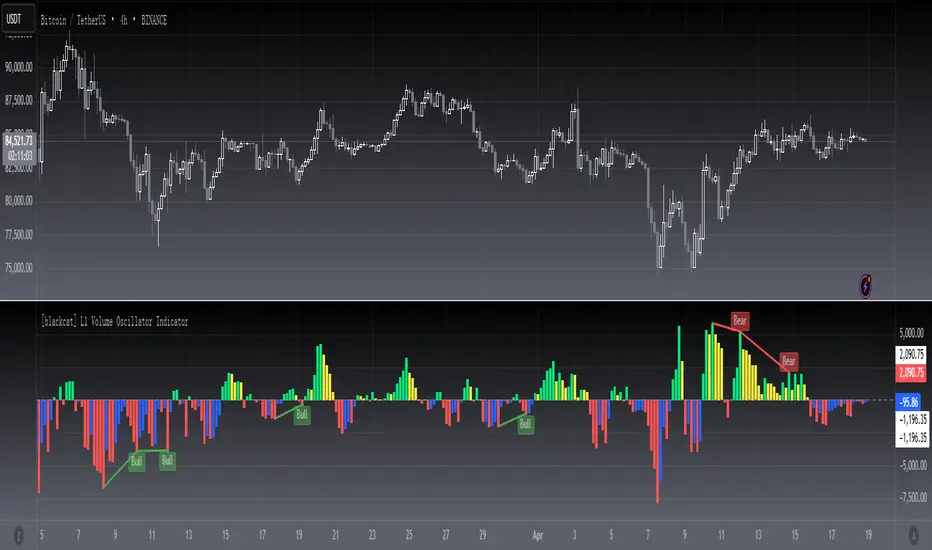
This is actually a volume-price indicator. With columns greater than zero line, which indicates a up trend. Otherwise, it is a down trend. Green columns indicate up trend pump; yellow columns indicate up trend retracements; red columns indicate down trend dump; blue columns indicate down trend re-bounce.
Key Signal
VolOsc --> volume osillator indicator.
Remarks
This is a Level 1 free and open source indicator.
Feedbacks are appreciated.
Background
Omega Research proposed volume oscillator indicator in June 2000.
Function
This is actually a volume-price indicator. With columns greater than zero line, which indicates a up trend. Otherwise, it is a down trend. Green columns indicate up trend pump; yellow columns indicate up trend retracements; red columns indicate down trend dump; blue columns indicate down trend re-bounce.
Key Signal
VolOsc --> volume osillator indicator.
Remarks
This is a Level 1 free and open source indicator.
Feedbacks are appreciated.
Nota Keluaran
OVERVIEWThe L1 Volume Oscillator Indicator by blackcat1402 is designed to help traders identify potential buy or sell opportunities based on volume divergences in the market. This script calculates a volume oscillator using customizable average lengths and detects various types of divergences (regular and hidden). It plots these divergences directly on the chart with clear labels and colors, making it easier for users to spot trends and make informed trading decisions.
This indicator supports four main types of divergences:
Regular Bullish Divergences 📈💚
Hidden Bullish Divergences 📉💛
Regular Bearish Divergences 📉❤️🔥
Hidden Bearish Divergences 📈🧡
It also provides alert conditions that can be used to notify you when specific divergence patterns are detected.
FEATURES
Customizable average length for calculating the volume oscillator.
Detection of both regular and hidden bullish/bearish divergences.
Clear plotting of divergences with distinct colors and labels.
Alerts for different types of divergences.
Adjustable lookback ranges for detecting pivots.
HOW TO USE
Add the L1 Volume Oscillator indicator to your TradingView chart.
Configure the input parameters according to your preferences:
Average Length: The period over which the volume oscillator is calculated.
Pivot Lookback Right/Lef: The number of bars to consider for identifying pivots.
Max/MIn of Lookback Range: Define the range within which to detect divergences.
Enable/disable the plotting of each type of divergence as needed.
Set up alerts if desired to receive notifications when specific divergence patterns occur.
INPUT PARAMETERS
Average Length: Defines the period for calculating the volume oscillator.
Pivot Lookback Left/Right: Specifies the number of bars to analyze for detecting pivots.
Max/Min of Lookback Range: Sets the upper and lower bounds for detecting divergences.
Plot Options:
Plot Bullish: Toggle to show/hide regular bullish divergences.
Plot Hidden Bullish: Toggle to show/hide hidden bullish divergences.
Plot Bearish: Toggle to show/hide regular bearish divergences.
Plot Hidden Bearish: Toggle to show/hide hidden bearish divergences.
NOTES
Ensure that the maximum bars back setting is sufficient to capture all necessary data points.
Experiment with different parameter values to optimize performance for your specific trading strategy.
Use this indicator alongside other technical analysis tools for more robust decision-making.
Skrip sumber terbuka
Dalam semangat TradingView sebenar, pencipta skrip ini telah menjadikannya sumber terbuka, jadi pedagang boleh menilai dan mengesahkan kefungsiannya. Terima kasih kepada penulis! Walaupuan anda boleh menggunakan secara percuma, ingat bahawa penerbitan semula kod ini tertakluk kepada Peraturan Dalaman.
Avoid losing contact!Don't miss out! The first and most important thing to do is to join my Discord chat now! Click here to start your adventure: discord.com/invite/ZTGpQJq 防止失联,请立即行动,加入本猫聊天群: discord.com/invite/ZTGpQJq
Penafian
Maklumat dan penerbitan adalah tidak bertujuan, dan tidak membentuk, nasihat atau cadangan kewangan, pelaburan, dagangan atau jenis lain yang diberikan atau disahkan oleh TradingView. Baca lebih dalam Terma Penggunaan.