OPEN-SOURCE SCRIPT
Vwap Daily By Samsung
Title
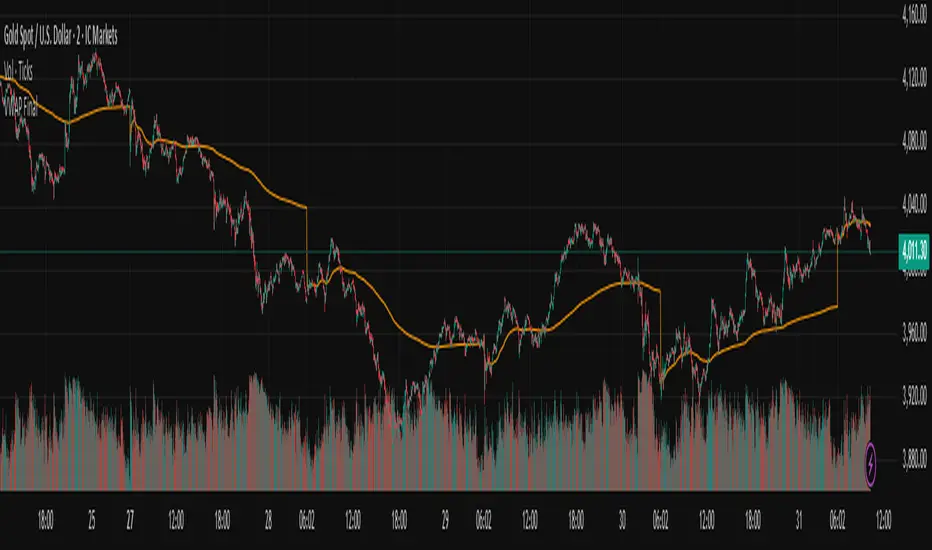
Daily VWAP with Historical Lookback (Logic Fix)
Description
This script calculates and plots the daily Volume-Weighted Average Price (VWAP), an essential tool for intraday traders.
What makes this indicator special is its robust plotting logic. Unlike many simple VWAP scripts that struggle to show data for previous days, this version includes a crucial fix that allows you to reliably display historical VWAP lines for as many days back as you need. This allows for more comprehensive backtesting and analysis of how price has interacted with the VWAP on previous trading days.
This is an indispensable tool for traders who use VWAP as a dynamic level of support/resistance, a benchmark for trade execution quality, or a gauge of the day's trend.
Key Features
Historical VWAP Display: Easily plot VWAP for multiple past days on your chart. Simply set the number of lookback days in the settings.
Accurate Daily Calculation: The VWAP calculation correctly resets at the beginning of each new trading session (00:00 server time).
Fully Customizable: You have full control over the appearance of the VWAP line, including its color, width, and style (Solid or Stepped).
Robust Plotting Engine: This script solves the common Pine Script issue where conditionally plotted historical lines fail to render. It works reliably on all intraday timeframes.
Built-in Debug Mode: For advanced users or those curious about the inner workings, a comprehensive debug mode can be enabled to display raw VWAP values, cumulative volume, and timeframe warnings.
How to Use
Add the "Daily VWAP with Historical Lookback" indicator to your chart.
IMPORTANT: Make sure you are on an intraday timeframe (e.g., 1H, 30M, 15M, 5M, 1M). This indicator is designed for intraday analysis and will display a warning if used on a daily or higher timeframe.
Open the indicator's settings.
In the "VWAP Settings" tab, adjust the "Lookback Days to Display" to set how many previous days of VWAP you want to see. (e.g., 0 for today only, 1 for today and yesterday, 10 for the last 10 days).
Customize the line's appearance in the "Line Style" tab.
The "Logic Fix" Explained (For Developers)
A common challenge in Pine Script is conditionally plotting data for historical bars. Many scripts attempt this by dynamically changing the plot color to na (transparent) for bars that shouldn't be displayed. This method is often unreliable and can result in the entire plot failing to render.
This script employs a more robust and standard approach: manipulating the data series itself.
The Problem: plot(vwap, color = shouldPlot ? color.red : na) can be buggy.
The Solution: plot(shouldPlot ? vwap : na, color = color.red) is reliable.
Instead of changing the color, we create a new data series (plotVwap). This series contains the vwapValue only on the bars that meet our date criteria. On all other bars, its value is na (Not a Number). The plot() function is designed to handle na values by simply "lifting the pen," creating a clean break in the line. This ensures that the VWAP is drawn only for the selected days, with 100% reliability across all historical data.
Settings Explained
Lookback Days to Display: Sets the number of past days (from the last visible bar) for which to display the VWAP.
Line Color, Width, and Style: Standard cosmetic settings for the VWAP line.
Enable Debug Mode (Master Switch): Toggles all debugging features on or off. It is enabled by default to help new users.
Display Debug: Cumulative Volume: When enabled, it shows the daily cumulative volume in a gray area on a separate pane.
Display Debug: Raw VWAP Value: When enabled, it plots the raw, unfiltered VWAP calculation for all days on the chart, helping to verify the core logic.
This script is provided for educational and informational purposes. Trading involves significant risk. Always conduct your own research and analysis before making any trading decisions.
If you find this script useful, a 'Like' is always appreciated! Happy trading
Skrip sumber terbuka
Dalam semangat TradingView sebenar, pencipta skrip ini telah menjadikannya sumber terbuka, jadi pedagang boleh menilai dan mengesahkan kefungsiannya. Terima kasih kepada penulis! Walaupuan anda boleh menggunakan secara percuma, ingat bahawa penerbitan semula kod ini tertakluk kepada Peraturan Dalaman.
Penafian
Maklumat dan penerbitan adalah tidak bertujuan, dan tidak membentuk, nasihat atau cadangan kewangan, pelaburan, dagangan atau jenis lain yang diberikan atau disahkan oleh TradingView. Baca lebih dalam Terma Penggunaan.