OPEN-SOURCE SCRIPT
Telah dikemas kini High-Low of X Bar
Overview
Key Features
Inputs
Color Settings
Usage Instructions
Notes
- The High-Low of X Bar indicator allows traders to visualize historical high and low values from a specific number of bars ago directly on the chart.
- Provides insight into past price action by displaying high, low, and their difference at the most recent bar.
- Customizable inputs and color settings for labels enhance usability and visual integration with your chart.
Key Features
- Historical Data Analysis: Displays the high, low, and the difference between these values from a specified number of bars ago.
- Customizable Inputs: Set the number of bars ago to review historical price points, with a range from 1 to 2000 bars. Premium users can exceed this range.
- Dynamic Labeling: Option to show high, low, and difference values as labels on the chart, with customizable text and background colors.
- Color Customization: Customize label colors for high, low, and difference values, as well as for cases with insufficient bars.
Inputs
- Number of Bars Ago: Enter the number of bars back from the current bar to analyze historical high and low values.
- Show High Value: Toggle to display the historical high value.
- Show Low Value: Toggle to display the historical low value.
- Show Difference Value: Toggle to display the difference between high and low values.
Color Settings
- High Label Background Color: Set the background color of the high value label.
- High Label Text Color: Choose the text color for the high value label.
- Low Label Background Color: Set the background color of the low value label.
- Low Label Text Color: Choose the text color for the low value label.
- Difference Label Background Color: Set the background color of the difference label.
- Difference Label Text Color: Choose the text color for the difference label.
- Not Enough Bars Label Background Color: Set the background color for the label shown when there are insufficient bars.
- Not Enough Bars Label Text Color: Choose the text color for the insufficient bars label.
Usage Instructions
- Add to Chart: Apply the High-Low of X Bar indicator to your TradingView chart.
- Configure Settings: Adjust the number of bars ago and display options according to your analysis needs.
- Customize Appearance: Set the colors for the labels to match your chart's style.
- Analyze: Review the high, low, and their difference directly on your chart for immediate insights into past price movements.
Notes
- Ensure your chart has sufficient historical data for the indicator to function properly.
- Customize label visibility and colors based on your preference and trading strategy.
Nota Keluaran
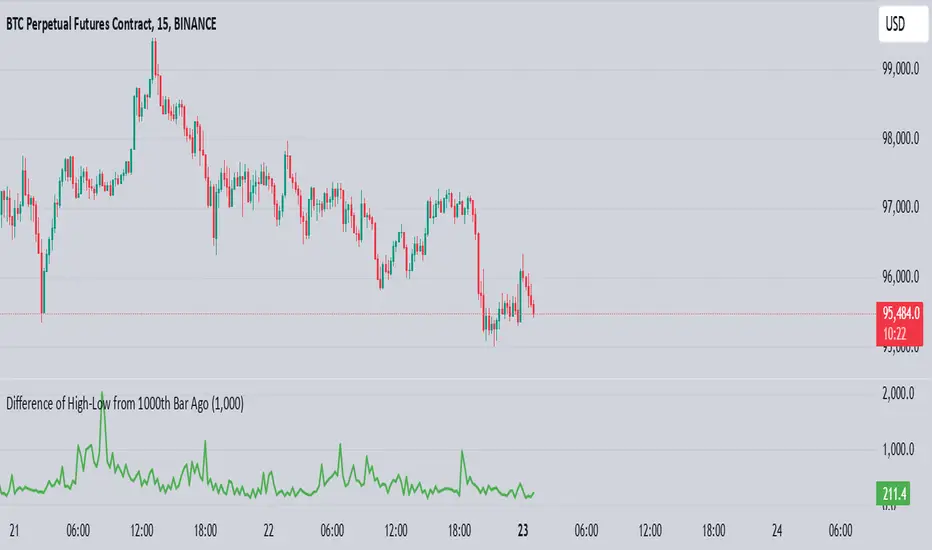
Added a line chart to visualize the difference of high and low if X (e.g., 1000th) bar from the current one. X can be adjusted as needed. Skrip sumber terbuka
Dalam semangat TradingView sebenar, pencipta skrip ini telah menjadikannya sumber terbuka, jadi pedagang boleh menilai dan mengesahkan kefungsiannya. Terima kasih kepada penulis! Walaupuan anda boleh menggunakan secara percuma, ingat bahawa penerbitan semula kod ini tertakluk kepada Peraturan Dalaman.
Penafian
Maklumat dan penerbitan adalah tidak bertujuan, dan tidak membentuk, nasihat atau cadangan kewangan, pelaburan, dagangan atau jenis lain yang diberikan atau disahkan oleh TradingView. Baca lebih dalam Terma Penggunaan.
Skrip sumber terbuka
Dalam semangat TradingView sebenar, pencipta skrip ini telah menjadikannya sumber terbuka, jadi pedagang boleh menilai dan mengesahkan kefungsiannya. Terima kasih kepada penulis! Walaupuan anda boleh menggunakan secara percuma, ingat bahawa penerbitan semula kod ini tertakluk kepada Peraturan Dalaman.
Penafian
Maklumat dan penerbitan adalah tidak bertujuan, dan tidak membentuk, nasihat atau cadangan kewangan, pelaburan, dagangan atau jenis lain yang diberikan atau disahkan oleh TradingView. Baca lebih dalam Terma Penggunaan.