OPEN-SOURCE SCRIPT
Telah dikemas kini [blackcat] L3 Financial Minesweeper: Altman Z Score
Level: 3
Background
The Altman Z-score is the output of a credit-strength test that gauges a publicly traded manufacturing company's likelihood of bankruptcy. The Altman Z-score is a formula for determining whether a company, notably in the manufacturing space, is headed for bankruptcy.
Function
The possibility of financial failure or bankruptcy of the enterprise is analyzed and predicted through the comprehensive score. The lower the Z value, the more likely the enterprise will go bankrupt. By calculating the Z value of an enterprise for several consecutive years, we can find out whether the enterprise has signs of financial crisis. Generally speaking, when the Z value is greater than 2.675, it indicates that the financial situation of the enterprise is good, and the possibility of bankruptcy is small; When the value is less than 1.81, it indicates that the enterprise is in a potential bankruptcy crisis; when the Z value is between 1.81 and 2.675, it is called a "gray area, indicating that the financial situation of the enterprise is extremely unstable.
Remarks
STOCKs ONLY which require financial data.
X1~X5 coefficients can be customized for different stock markets.
Compared to TradingView official Altman Z-Score Indicator.
Feedbacks are appreciated.
Nota Keluaran
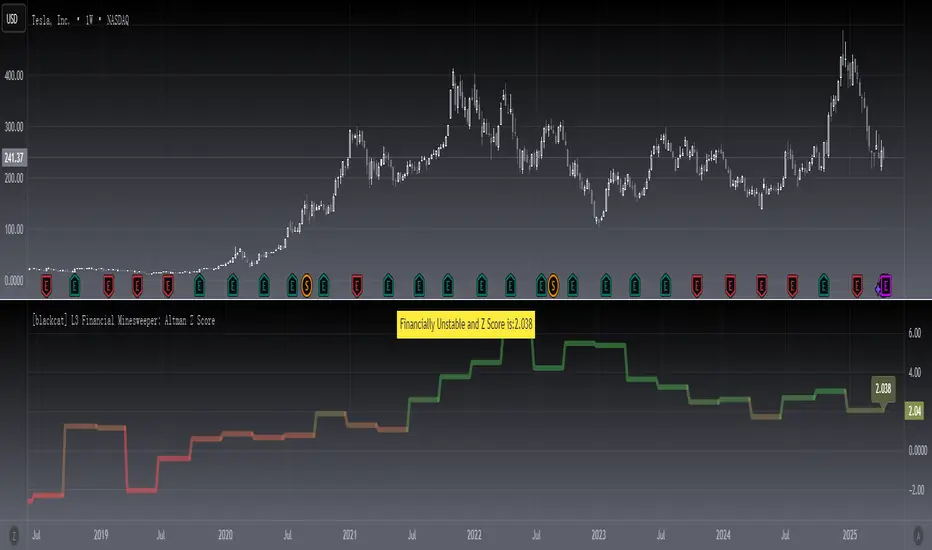
OVERVIEWThe [blackcat] L3 Financial Minesweeper: Altman Z Score indicator assesses the financial health of a company using the Altman Z-Score model. This model combines various financial ratios to predict the likelihood of bankruptcy or financial distress. The indicator plots the calculated Z-Score on the chart and provides visual feedback on the company's financial status, helping traders make informed decisions about their investments 💼📉.
FEATURES
Calculates the Altman Z-Score based on key financial metrics:
Working Capital / Total Assets
Retained Earnings / Total Assets
Earnings Before Interest and Taxes / Total Assets
Market Value of Equity / Book Value of Liabilities
Sales / Total Assets
Plots the Z-Score on the chart with dynamic coloring based on its value 🎨
Provides real-time assessment of the company's financial status:
Financially Sound (Z-Score > 2.675)
Financially Unstable (1.81 < Z-Score ≤ 2.675)
Financially Risky (Z-Score ≤ 1.81)
Displays the Z-Score value and financial status in a table format ⚙️
Allows customization of coefficients used in the Z-Score calculation 🔧
HOW TO USE
Add the indicator to your TradingView chart by selecting it from the indicators list.
Observe the plotted Z-Score line and its corresponding color changes.
Monitor the displayed table for real-time updates on the company's financial status.
Use this information alongside other fundamental and technical analyses for better decision-making.
LIMITATIONS
The indicator relies on quarterly financial data, which might not capture recent changes immediately.
The accuracy of predictions depends on the quality and timeliness of the input data 🕒.
Users should consider multiple factors beyond just the Z-Score when evaluating a company's financial health.
NOTES
Ensure that you have access to reliable financial data sources for accurate calculations.
Test the indicator thoroughly on historical data before applying it to live trading situations 🔍.
Customize coefficient inputs if necessary to fit specific market conditions or sectors.
Skrip sumber terbuka
Dalam semangat TradingView sebenar, pencipta skrip ini telah menjadikannya sumber terbuka, jadi pedagang boleh menilai dan mengesahkan kefungsiannya. Terima kasih kepada penulis! Walaupuan anda boleh menggunakan secara percuma, ingat bahawa penerbitan semula kod ini tertakluk kepada Peraturan Dalaman.
Avoid losing contact!Don't miss out! The first and most important thing to do is to join my Discord chat now! Click here to start your adventure: discord.com/invite/ZTGpQJq 防止失联,请立即行动,加入本猫聊天群: discord.com/invite/ZTGpQJq
Penafian
Maklumat dan penerbitan adalah tidak bertujuan, dan tidak membentuk, nasihat atau cadangan kewangan, pelaburan, dagangan atau jenis lain yang diberikan atau disahkan oleh TradingView. Baca lebih dalam Terma Penggunaan.