OPEN-SOURCE SCRIPT
Intraday Trend Candles

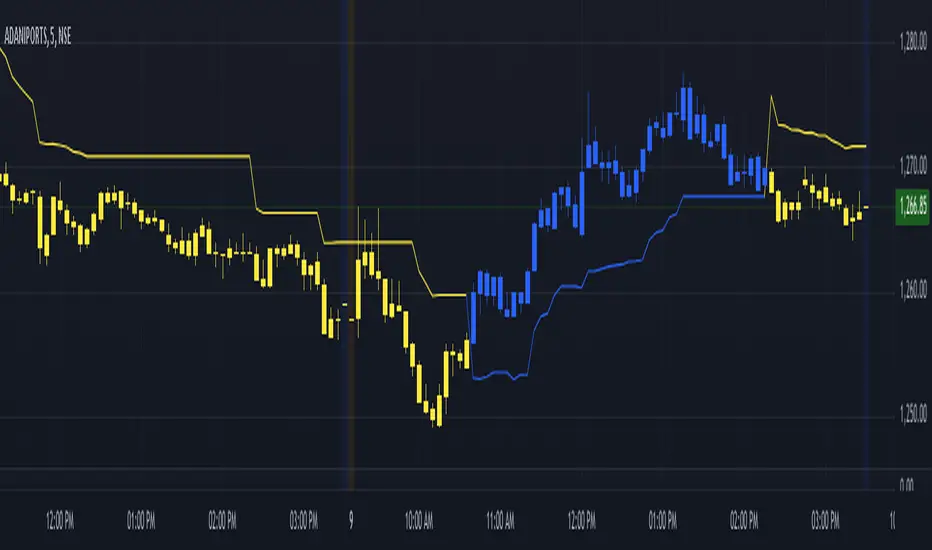
The Intraday Trend Candles (ITC) indicator is a Pine Script-based tool designed for traders seeking to visualize market trends effectively. Using a combination of the Look Back Period, a multiplier for true range, and linearly weighted moving averages (LWMA), this indicator calculates dynamic trend limits that adapt to price movements. It identifies key trend shifts by comparing the current price to these dynamic thresholds, resulting in a visually intuitive display of market bias directly on the chart. The indicator is particularly well-suited for intraday trading, as it provides responsive insights tailored to short-term price action.
The ITC plots color-coded candles, highlighting bullish trends in blue and bearish trends in yellow, with gray indicating indecision or trend continuation. This color-coded approach makes it easy to identify reversals and trend dynamics at a glance. Additionally, a trend line is plotted to enhance clarity, signaling whether the price is favoring the upper or lower threshold of the calculated range. With built-in alerts for trend reversals, traders can stay informed about critical market shifts without constantly monitoring the chart. This combination of visual cues and alerts makes the ITC a versatile and powerful tool for traders focusing on momentum and trend-following strategies.
The ITC plots color-coded candles, highlighting bullish trends in blue and bearish trends in yellow, with gray indicating indecision or trend continuation. This color-coded approach makes it easy to identify reversals and trend dynamics at a glance. Additionally, a trend line is plotted to enhance clarity, signaling whether the price is favoring the upper or lower threshold of the calculated range. With built-in alerts for trend reversals, traders can stay informed about critical market shifts without constantly monitoring the chart. This combination of visual cues and alerts makes the ITC a versatile and powerful tool for traders focusing on momentum and trend-following strategies.
Skrip sumber terbuka
Dalam semangat TradingView sebenar, pencipta skrip ini telah menjadikannya sumber terbuka, jadi pedagang boleh menilai dan mengesahkan kefungsiannya. Terima kasih kepada penulis! Walaupuan anda boleh menggunakan secara percuma, ingat bahawa penerbitan semula kod ini tertakluk kepada Peraturan Dalaman.
Penafian
Maklumat dan penerbitan adalah tidak bertujuan, dan tidak membentuk, nasihat atau cadangan kewangan, pelaburan, dagangan atau jenis lain yang diberikan atau disahkan oleh TradingView. Baca lebih dalam Terma Penggunaan.