PROTECTED SOURCE SCRIPT
🔵Blue Mark
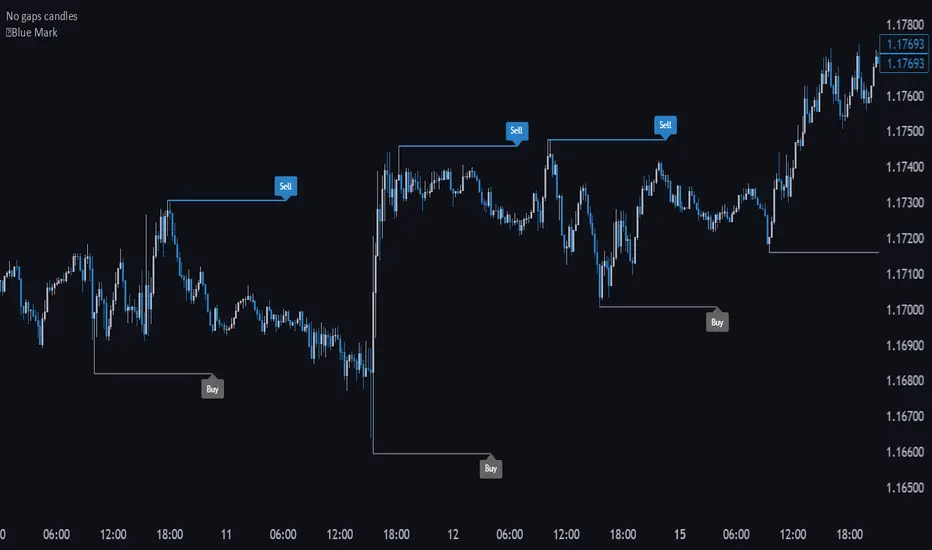
📌 Blue Mark – TradingView Indicator
The Blue Mark indicator highlights extreme price points across multiple timeframes (15m, 5m, 1m), helping intraday traders identify liquidity zones and areas of institutional interest. It is designed for traders who want to spot high-probability entry and exit points based on market structure and volume concentration.
✔️ Marks extreme highs and lows on 15m, 5m, and 1m charts
✔️ Ideal for intraday trading and short-term strategies
✔️ Helps detect liquidity zones where institutional orders are likely concentrated
✔️ Supports tactical entries and exits aligned with market structure
How to use:
Apply the indicator to your chart.
Observe the marked extreme points on different timeframes.
Use these levels to plan entries, exits, or confirm areas of institutional interest.
Skrip dilindungi
Skrip ini diterbitkan sebagai sumber tertutup. Akan tetapi, anda boleh menggunakannya secara bebas dan tanpa apa-apa had – ketahui lebih di sini.
Penafian
Maklumat dan penerbitan adalah tidak bertujuan, dan tidak membentuk, nasihat atau cadangan kewangan, pelaburan, dagangan atau jenis lain yang diberikan atau disahkan oleh TradingView. Baca lebih dalam Terma Penggunaan.