OPEN-SOURCE SCRIPT
[boitl] Trendfilter
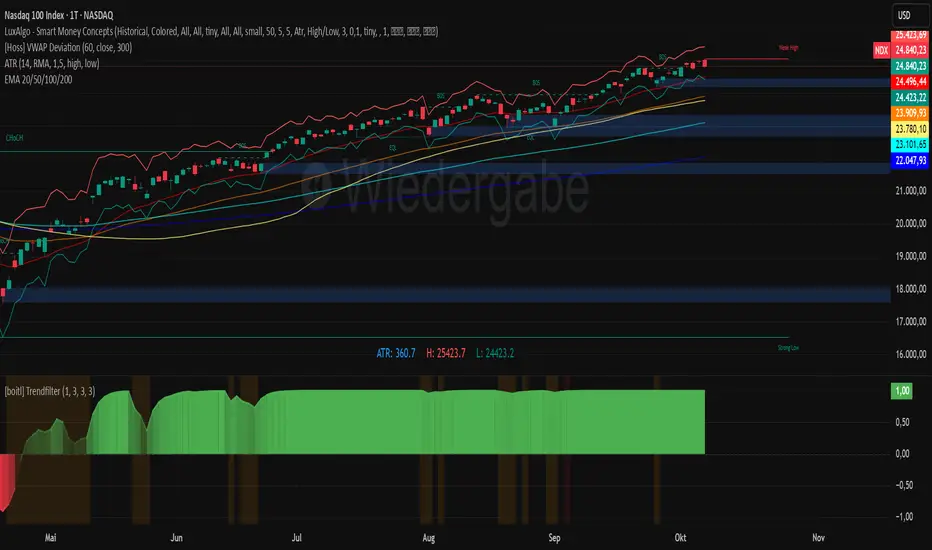
🧭 Trend Filter – Curve View (1D / 1H + M15 Check)
A multi-timeframe trend filter that blends daily, hourly, and 15-minute data into a smooth, color-coded curve displayed in a separate panel.
It visualizes both trend direction and strength while accounting for overextension, providing a reliable “context indicator” for entries and filters.
🔍 Concept
The indicator evaluates three timeframes:
1D (Daily) → SMA200 for long-term trend bias
1H (Hourly) → EMA50 for medium-term confirmation
15M (Intraday) → EMA20 + ATR to detect overextension or mean reversion zones
It computes a continuous trend score between −1 and +1:
+1 → Strong bullish alignment (D1 & H1 both up)
−1 → Strong bearish alignment (D1 & H1 both down)
≈ 0 → Neutral, conflicting, or overextended conditions
The score is smoothed and normalized for a clean visual curve —
green for bullish, red for bearish, with dynamic transparency based on strength.
⚙️ Logic Overview
Timeframe Indicator Purpose
1D SMA200 Long-term trend direction
1H EMA50 Medium-term confirmation
15M EMA20 + ATR Overextension control
Alignment between D1 and H1 defines clear trend bias
Conflicts between them reduce the trend score
M15 overextension (price far from EMA20) softens the signal further
The result is a responsive trend-strength oscillator, ideal for multi-timeframe setups.
🧩 Use Cases
As a trend filter for strategies (e.g. allow entries only if score > 0.3 or < −0.3)
As a visual confirmation of higher-timeframe direction
To avoid trades during conflict or exhaustion
💡 Visualization
Single curve (area plot):
Green = bullish bias
Red = bearish bias
Transparency increases with weaker trend
Background colors:
🟠 Orange → D1/H1 conflict
🔴 Light red → M15 overextension active
Optional: binary alignment line (+1 / 0 / −1) for simplified display
⚙️ Parameters
Proximity to EMA20 (M15) = X×ATR → defines “near” condition
Overextension threshold = X×ATR → sets exhaustion boundary
EMA smoothing → reduces noise for a smoother score
Toggle overextension impact on/off
Skrip sumber terbuka
Dalam semangat TradingView sebenar, pencipta skrip ini telah menjadikannya sumber terbuka, jadi pedagang boleh menilai dan mengesahkan kefungsiannya. Terima kasih kepada penulis! Walaupuan anda boleh menggunakan secara percuma, ingat bahawa penerbitan semula kod ini tertakluk kepada Peraturan Dalaman.
Penafian
Maklumat dan penerbitan adalah tidak bertujuan, dan tidak membentuk, nasihat atau cadangan kewangan, pelaburan, dagangan atau jenis lain yang diberikan atau disahkan oleh TradingView. Baca lebih dalam Terma Penggunaan.