PROTECTED SOURCE SCRIPT
Telah dikemas kini US Recessions with SPX reversals v3 [FornaxTV]
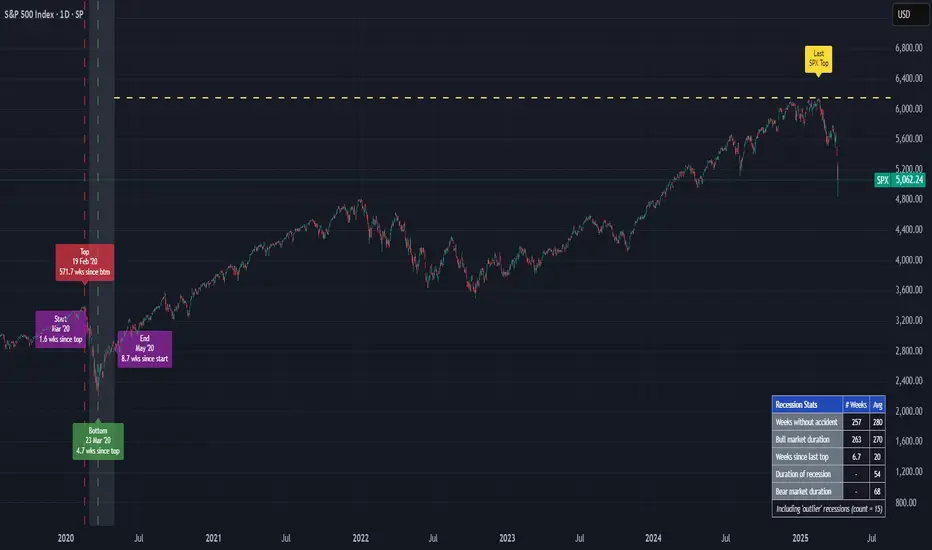
In addition to highlighting periods of official US recessions (as defined by the NBER) this script also displays vertical lines for the SPX market top and bottom associated with each recession.
This facilitates more detailed analysis of potential leading and coincident indicators for market tops and bottoms. This is particularly relevant for market tops, which typically precede the start of a recession by several months.
In addition to recessions with SPX market tops and market bottoms:
- A horizontal line can optionally be displayed for the last market top. (NOTE: this line will only be displayed for SPX tickers.)
- Labels can optionally be displayed for market tops & bottoms, plus the start and end of recessions. If the statistics are enabled (see below) these labels will also indicate the number of weeks between key market events, e.g. a market top and the start of a recession.
- A statistics table can optionally be displayed, contained statistics such as the number of weeks wince the last recession & market bottom, as well as averages for all recessions included in the analysis set.
For the recession statistics:
- "Outlier" recessions such as 1945 (WWII, where the market top occurred well after the recession itself) and 2020 (COVID pandemic, which was arguably not a "true" economic recession) can optionally be excluded.
- You can choose to exclude recessions occurring before a specific year.
Nota Keluaran
Fixed issue with "Last SPX Top" label displayNota Keluaran
Minor improvements to the (optional) summary table. All stats will be highlighted yellow if the current value exceeds the historical average, or red if the current value exceeds the historical average by more than 10%.Skrip dilindungi
Skrip ini diterbitkan sebagai sumber tertutup. Akan tetapi, anda boleh menggunakannya secara bebas dan tanpa apa-apa had – ketahui lebih di sini.
Penafian
Maklumat dan penerbitan adalah tidak bertujuan, dan tidak membentuk, nasihat atau cadangan kewangan, pelaburan, dagangan atau jenis lain yang diberikan atau disahkan oleh TradingView. Baca lebih dalam Terma Penggunaan.
Skrip dilindungi
Skrip ini diterbitkan sebagai sumber tertutup. Akan tetapi, anda boleh menggunakannya secara bebas dan tanpa apa-apa had – ketahui lebih di sini.
Penafian
Maklumat dan penerbitan adalah tidak bertujuan, dan tidak membentuk, nasihat atau cadangan kewangan, pelaburan, dagangan atau jenis lain yang diberikan atau disahkan oleh TradingView. Baca lebih dalam Terma Penggunaan.