OPEN-SOURCE SCRIPT
Williams Accelerator Oscillator — AC
What it is
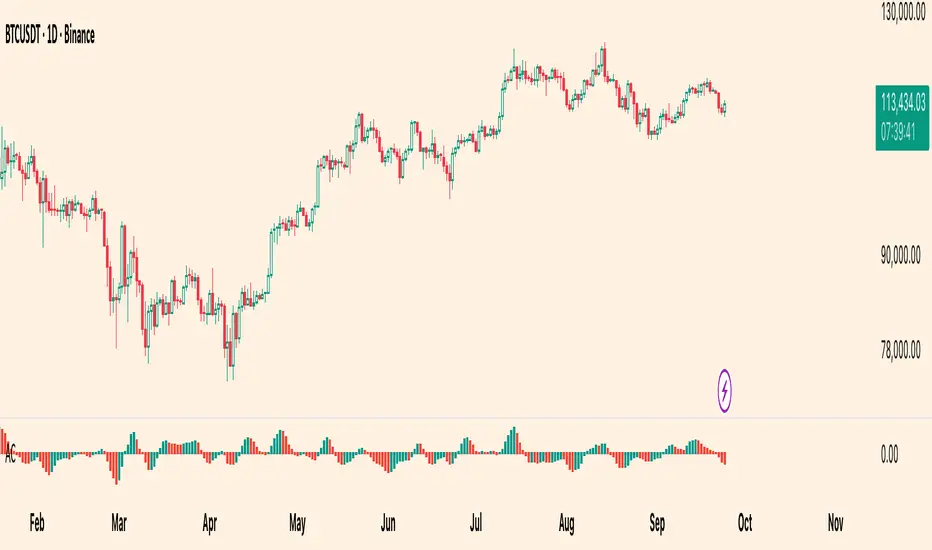
The Accelerator Oscillator (AC) measures the acceleration/deceleration of momentum. It’s derived from the Awesome Oscillator (AO) and shows whether momentum is speeding up or slowing down. In this implementation, columns are green when AC rises vs. the previous bar and red when it falls.
How it’s calculated
How to read it (typical interpretation)
Inputs
Plots
Alerts
Usage tips
Limitations
Credits
Concept by Bill Williams. This script is an independent implementation for educational and research purposes.
Disclaimer
No financial advice. Markets involve risk; test thoroughly before live use.
The Accelerator Oscillator (AC) measures the acceleration/deceleration of momentum. It’s derived from the Awesome Oscillator (AO) and shows whether momentum is speeding up or slowing down. In this implementation, columns are green when AC rises vs. the previous bar and red when it falls.
How it’s calculated
- Price source: Median Price (HL2) by default; Close can be used instead.
- AO = SMA(HL2, fastLen) − SMA(HL2, slowLen) (defaults: 5 & 34).
- AC = AO − SMA(AO, signalLen) (default: 5).
- Coloring: Green if AC > AC[1], else Red.
- Zero line (optional) helps contextualize acceleration around neutral.
How to read it (typical interpretation)
- Above 0: Upside acceleration (bullish pressure increasing).
- Below 0: Downside acceleration (bearish pressure increasing).
- Color sequences: Consecutive green columns suggest increasing upside acceleration; consecutive red columns suggest increasing downside acceleration.
- Note: AC reflects change in momentum, not trend direction by itself. Many traders confirm with trend filters or price structure before acting.
Inputs
- AO Fast SMA (default 5)
- AO Slow SMA (default 34)
- AC Signal SMA (default 5) — smoothing for the AO used in AC calc
- Use Median Price (HL2) for AO (on/off)
- Show zero line (on/off)
- Show AO (for reference) (on/off)
- Show AC signal (SMA of AO) (on/off)
Plots
- AC Histogram — column chart colored by acceleration (green/red).
- Zero — optional baseline at 0.
- AO — optional reference line.
- AO Signal (SMA) — optional smoothing line of AO.
Alerts
- AC crosses above 0 — acceleration flips positive.
- AC crosses below 0 — acceleration flips negative.
- AC green above zero — AC rising and > 0.
- AC red below zero — AC falling and < 0.
Usage tips
- On lower timeframes, consider a slightly larger signalLen to reduce noise.
- Confirm with price action, trend filters, or volatility context.
- Values update intrabar; for stricter signals, confirm on bar close.
Limitations
- AC is built from moving averages and is therefore lagging relative to raw price.
- It is not normalized; behavior can vary by instrument and timeframe.
- Do not use in isolation for entries/exits without risk management.
Credits
Concept by Bill Williams. This script is an independent implementation for educational and research purposes.
Disclaimer
No financial advice. Markets involve risk; test thoroughly before live use.
Skrip sumber terbuka
Dalam semangat TradingView sebenar, pencipta skrip ini telah menjadikannya sumber terbuka, jadi pedagang boleh menilai dan mengesahkan kefungsiannya. Terima kasih kepada penulis! Walaupuan anda boleh menggunakan secara percuma, ingat bahawa penerbitan semula kod ini tertakluk kepada Peraturan Dalaman.
✅My Telegram
t.me/charyyevn
t.me/charyyevn
Penafian
Maklumat dan penerbitan adalah tidak bertujuan, dan tidak membentuk, nasihat atau cadangan kewangan, pelaburan, dagangan atau jenis lain yang diberikan atau disahkan oleh TradingView. Baca lebih dalam Terma Penggunaan.