OPEN-SOURCE SCRIPT
Higher Time Frame Strat [QuantVue]
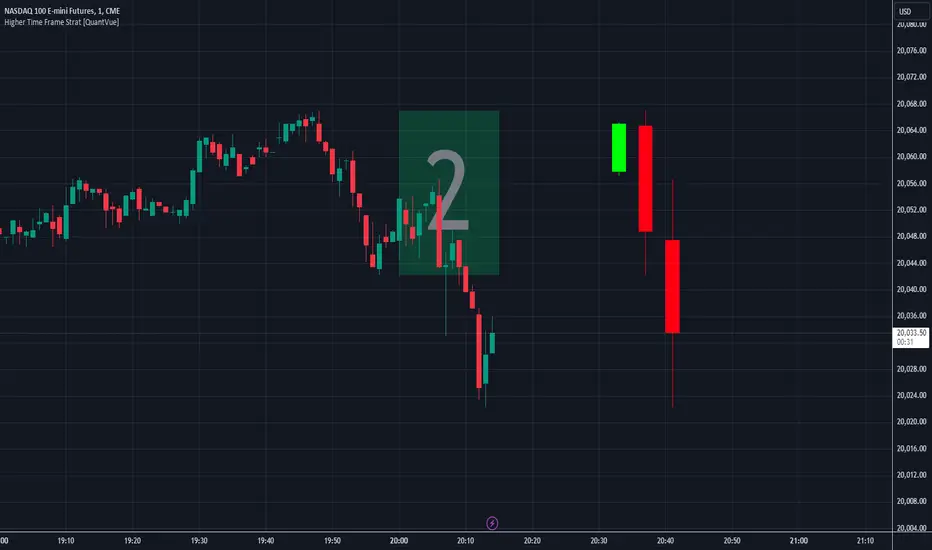
The Higher Time Frame Strat Indicator is a tool that helps traders visualize and analyze price action from a higher timeframe (HTF) on their current chart. It applies the Strat method, a trading strategy focused on identifying key price action setups by observing how current price bars relate to previous ones. This helps in understanding the market's structure and determining potential trading opportunities based on higher timeframe data.
Key Concepts:
Strat Basics:
Type 1 Bar (Inside Bar): The current bar's high is lower than the previous bar's high, and its low is higher than the previous bar's low. This signifies a consolidation, or indecision, as the price is contained within the previous bar's range.

Type 2 Bar (Directional Bar): The current bar either breaks above the previous bar's high (bullish) or stays above the previous bar's low (bearish), indicating a continuation in the price direction.

Type 3 Bar (Outside Bar): The current bar breaks both above the previous bar's high and below the previous bar's low, showing volatility and a potential reversal.

Higher Timeframe Visualization:
The indicator uses a user-defined higher timeframe (default: 1 hour) and plots the last three higher timeframe candles on the current chart.
Strat Classification:
When a new higher timeframe candle forms, the indicator draws a semi-transparent box around the candle's range (high to low), along with the Strat type label. This provides a visual cue to the trader about the structure of the newly formed candle and how it fits into the overall market movement.
The script classifies each higher timeframe candle as one of the Strat types (1, 2, or 3). Based on the relationship between the current candle and the previous candle's high/low, it assigns a label ("1", "2", or "3"), helping traders quickly identify the price action setup on the higher timeframe.

How to Use the Indicator:
Trend Continuation: Look for Type 2 bars, which indicate a continuation in the current trend. For example, a Type 2 up suggests the price is breaking above the previous high, potentially signaling further upward movement.

Reversals: Type 3 bars show increased volatility, where the price breaks both above and below the previous bar's range. This could indicate a reversal, so be prepared for a potential change in direction.

Consolidation: Inside bars (Type 1) signify a tightening range and can signal the beginning of a breakout once the price moves outside of the previous bar's high or low.

By combining these price action concepts with the visualization of higher timeframe data, traders can potentially get earlier entry and exits as a higher timeframe set up forms.
Key Concepts:
Strat Basics:
Type 1 Bar (Inside Bar): The current bar's high is lower than the previous bar's high, and its low is higher than the previous bar's low. This signifies a consolidation, or indecision, as the price is contained within the previous bar's range.
Type 2 Bar (Directional Bar): The current bar either breaks above the previous bar's high (bullish) or stays above the previous bar's low (bearish), indicating a continuation in the price direction.
Type 3 Bar (Outside Bar): The current bar breaks both above the previous bar's high and below the previous bar's low, showing volatility and a potential reversal.
Higher Timeframe Visualization:
The indicator uses a user-defined higher timeframe (default: 1 hour) and plots the last three higher timeframe candles on the current chart.
Strat Classification:
When a new higher timeframe candle forms, the indicator draws a semi-transparent box around the candle's range (high to low), along with the Strat type label. This provides a visual cue to the trader about the structure of the newly formed candle and how it fits into the overall market movement.
The script classifies each higher timeframe candle as one of the Strat types (1, 2, or 3). Based on the relationship between the current candle and the previous candle's high/low, it assigns a label ("1", "2", or "3"), helping traders quickly identify the price action setup on the higher timeframe.
How to Use the Indicator:
Trend Continuation: Look for Type 2 bars, which indicate a continuation in the current trend. For example, a Type 2 up suggests the price is breaking above the previous high, potentially signaling further upward movement.
Reversals: Type 3 bars show increased volatility, where the price breaks both above and below the previous bar's range. This could indicate a reversal, so be prepared for a potential change in direction.
Consolidation: Inside bars (Type 1) signify a tightening range and can signal the beginning of a breakout once the price moves outside of the previous bar's high or low.
By combining these price action concepts with the visualization of higher timeframe data, traders can potentially get earlier entry and exits as a higher timeframe set up forms.
Skrip sumber terbuka
Dalam semangat TradingView sebenar, pencipta skrip ini telah menjadikannya sumber terbuka, jadi pedagang boleh menilai dan mengesahkan kefungsiannya. Terima kasih kepada penulis! Walaupuan anda boleh menggunakan secara percuma, ingat bahawa penerbitan semula kod ini tertakluk kepada Peraturan Dalaman.
Get Access to the exclusive QuantVue indicators: quantvue.io/
Join thousands of traders in our Free Discord: discord.gg/tC7u7magU3
Join thousands of traders in our Free Discord: discord.gg/tC7u7magU3
Penafian
Maklumat dan penerbitan adalah tidak bertujuan, dan tidak membentuk, nasihat atau cadangan kewangan, pelaburan, dagangan atau jenis lain yang diberikan atau disahkan oleh TradingView. Baca lebih dalam Terma Penggunaan.