PROTECTED SOURCE SCRIPT
Telah dikemas kini ETHBTC Z-Score
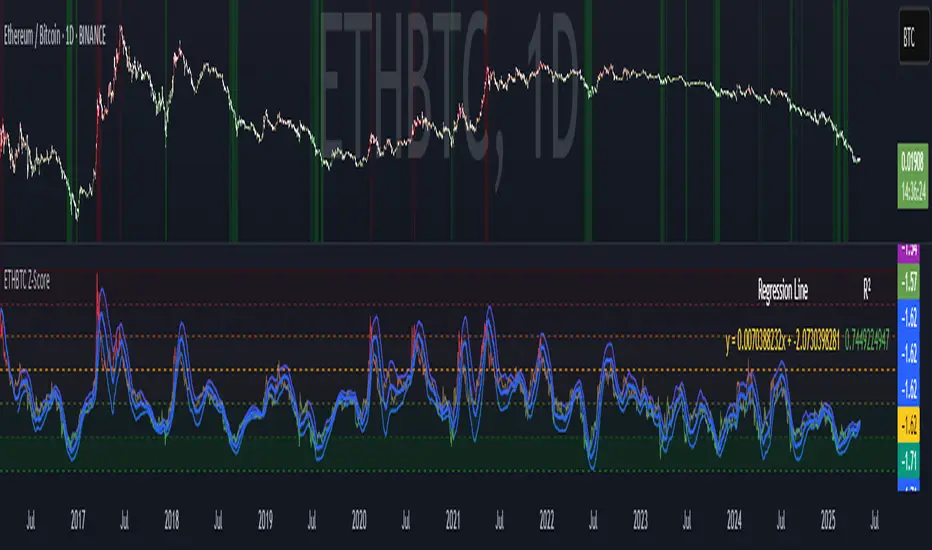
ETHBTC Z-Score Indicator
Key Features
Z-Score Calculation: Measures how far ETHBTC deviates from its mean over a user-defined period.
Linear Regression Line: Tracks the trend of the Z-score using least squares regression.
Standard Deviation Bands: Plots ±N standard deviations around the regression line to show expected Z-score range.
Dynamic Thresholds: Highlights overbought (e.g. Z > 1) and oversold (e.g. Z < -2) zones using color and background fill.
Visual & Table Display: Color-coded bars, horizontal level fills, and optional table showing regression formula and R².
Usage
Spot overbought/oversold extremes when Z-score crosses defined thresholds.
Use the regression line as a dynamic baseline and its bands as range boundaries.
Monitor R² to gauge how well the regression line fits the recent Z-score trend.
Example
Z > 1: ETHBTC may be overbought — potential caution or mean-reversion.
Z < -2: ETHBTC may be oversold — possible buying opportunity.
Z near regression line: Price is in line with recent trend.
Nota Keluaran
Updated to work on chart's timeframeSkrip dilindungi
Skrip ini diterbitkan sebagai sumber tertutup. Akan tetapi, anda boleh menggunakannya secara bebas dan tanpa apa-apa had – ketahui lebih di sini.
Penafian
Maklumat dan penerbitan adalah tidak bertujuan, dan tidak membentuk, nasihat atau cadangan kewangan, pelaburan, dagangan atau jenis lain yang diberikan atau disahkan oleh TradingView. Baca lebih dalam Terma Penggunaan.
Skrip dilindungi
Skrip ini diterbitkan sebagai sumber tertutup. Akan tetapi, anda boleh menggunakannya secara bebas dan tanpa apa-apa had – ketahui lebih di sini.
Penafian
Maklumat dan penerbitan adalah tidak bertujuan, dan tidak membentuk, nasihat atau cadangan kewangan, pelaburan, dagangan atau jenis lain yang diberikan atau disahkan oleh TradingView. Baca lebih dalam Terma Penggunaan.