Spot the Peak & Bottom
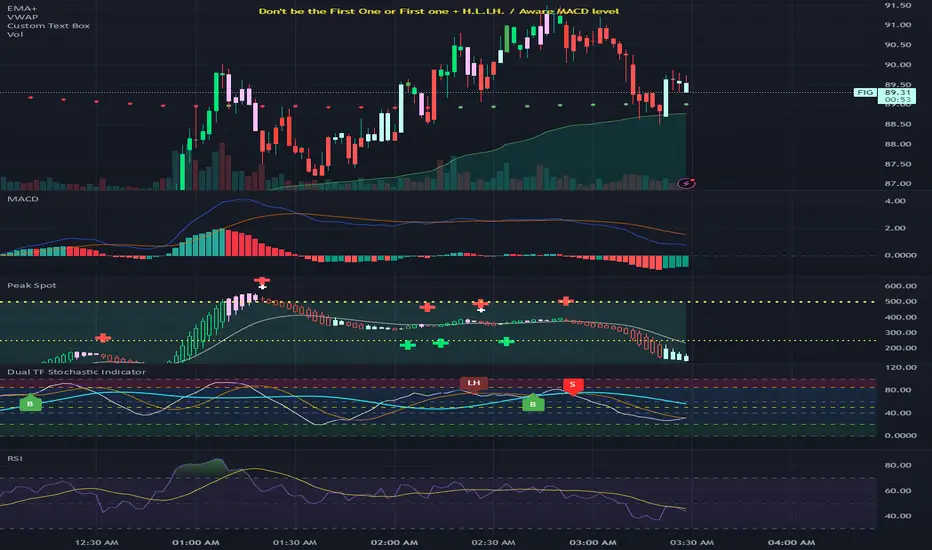
Core Components
1. Technical Foundation
Heikin-Ashi Candlesticks: Modified candlestick calculation that smooths price action
MACD Histogram: Custom STMC (Smooth Trend Momentum Change) oscillator
Multiple Price Sources: Support for open, high, low, close, and various averages (hl2, hlc3, ohlc4, hlcc4)
2. Pattern Detection System
Bullish Patterns:
HA D ↑ → HA ↑: Divergence resolution (Heikin-Ashi bearish but histogram strengthening, then turning bullish)
Normal Rise: HA rising + histogram strengthening/maintaining
Bottom Reversal: HA falling but histogram strengthening
Bearish Patterns:
HA U ↓ → HA ↓: Divergence resolution (Heikin-Ashi bullish but histogram weakening, then turning bearish)
Top Reversal: HA rising but histogram weakening
Strong Downtrend: HA falling + histogram weakening
Divergence Patterns:
HA D ↓: Heikin-Ashi bullish but momentum weakening
HA D ↑: Heikin-Ashi bearish but momentum strengthening
3. Signal Classification System
Bullish Signals (▲):
Bull Highlight: Higher HA close than previous signal (strongest)
Bull Normal: Normal signal within neutral range (-100 to 100)
Bull Gray: Normal signal outside neutral range
Bearish Signals (▼):
Bear Highlight: Lower HA close than previous signal (strongest)
Bear Normal: Normal signal within neutral range (-100 to 100)
Bear Gray: Normal signal outside neutral range
Transition Signals:
HA DD: Hollow green to hollow red transition
HA UU: Hollow red to hollow green transition
4. Visual Features
Color Coding:
Green/Lime: Bullish patterns and signals
Red/Orange: Bearish patterns and signals
Pink/Cyan: Divergence conditions
White: Neutral signals
Background Zones:
Upper Zone (50-500): Overbought/extreme high areas
Lower Zone (-50 to -500): Oversold/extreme low areas
Reference Lines: Do Not Short (-500), Do Not Long (500), Semi-lines (±250)
Display Modes:
Hybrid: Shows both MACD and Heikin-Ashi
MACD: MACD line and signal only
Histogram: Histogram only
5. Alert System
The script provides comprehensive alerts for:
Bull/Bear signal types (Highlight, Normal, Neutral Area)
HA DD/UU transitions
Divergence start/end conditions
6. Customization Options
MACD Settings: Fast/slow lengths, signal parameters
UI Options: Colors, display modes, background fills
Pattern Detection: Enable/disable various pattern types
Divergence Styling: Custom colors for divergence conditions
This indicator is particularly useful for traders who want to combine the smoothing benefits of Heikin-Ashi with the momentum insights of MACD for more accurate entry and exit timing.
Skrip jemputan sahaja
Hanya pengguna disahkan oleh penulis boleh mengakses skrip ini. Anda perlu memohon dan mendapatkan kebenaran untuk menggunakannya. Keizinan selalunya diberikan selepas pembayaran. Untuk lebih butiran, ikuti arahan penulis di bawah atau hubungi sickleavetoday secara terus.
TradingView TIDAK menyarankan pembayaran atau penggunaan skrip kecuali anda mempercayai sepenuhnya penulis dan memahami bagaimana ia berfungsi. Anda juga boleh menjumpai alternatif sumber terbuka dan percuma yang lain di dalam skrip komuniti kami.
Arahan penulis
Penafian
Skrip jemputan sahaja
Hanya pengguna disahkan oleh penulis boleh mengakses skrip ini. Anda perlu memohon dan mendapatkan kebenaran untuk menggunakannya. Keizinan selalunya diberikan selepas pembayaran. Untuk lebih butiran, ikuti arahan penulis di bawah atau hubungi sickleavetoday secara terus.
TradingView TIDAK menyarankan pembayaran atau penggunaan skrip kecuali anda mempercayai sepenuhnya penulis dan memahami bagaimana ia berfungsi. Anda juga boleh menjumpai alternatif sumber terbuka dan percuma yang lain di dalam skrip komuniti kami.