OPEN-SOURCE SCRIPT
CM_OldSchool_Projected_high_Low
Heard this story from Larry Williams…the trader who holds the record for winning the U.S. Trading Championship by turning $10K in to 2 Million.
A trader named Owen Taylor developed this formula as a Floor Trader before to calculate the Projected High and Low of the next day.
The formula worked so well…Owen charged other Traders 1K to get it.
I was pretty impressed with the results…so I coded it for the Weekly, Monthly, Quarterly, and Yearly Projected High Low.
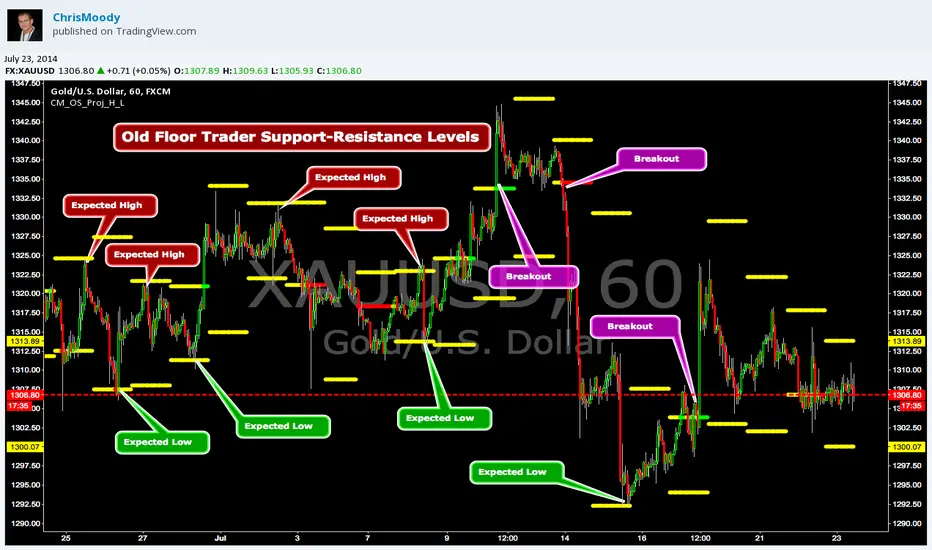
While Owen considered these levels to be major support and resistance, Larry has developed many strategies based on the Breakout of the Projected High Low.
Therefore I coded it so the Levels would plot Yellow, and change to Green if the Projected High was taken out, and Red if the Projected Low was taken out.
***I’ve noticed on many instruments, Stocks, Index’s, Forex etc., depending on the instrument it works great as Support/Resistance or Breakouts.
***On a Daily Chart put the Quarterly and Yearly levels on SPY and EURUSD and go back about 10 years. Levels are pretty accurate.
A trader named Owen Taylor developed this formula as a Floor Trader before to calculate the Projected High and Low of the next day.
The formula worked so well…Owen charged other Traders 1K to get it.
I was pretty impressed with the results…so I coded it for the Weekly, Monthly, Quarterly, and Yearly Projected High Low.
While Owen considered these levels to be major support and resistance, Larry has developed many strategies based on the Breakout of the Projected High Low.
Therefore I coded it so the Levels would plot Yellow, and change to Green if the Projected High was taken out, and Red if the Projected Low was taken out.
***I’ve noticed on many instruments, Stocks, Index’s, Forex etc., depending on the instrument it works great as Support/Resistance or Breakouts.
***On a Daily Chart put the Quarterly and Yearly levels on SPY and EURUSD and go back about 10 years. Levels are pretty accurate.
Skrip sumber terbuka
Dalam semangat TradingView sebenar, pencipta skrip ini telah menjadikannya sumber terbuka, jadi pedagang boleh menilai dan mengesahkan kefungsiannya. Terima kasih kepada penulis! Walaupuan anda boleh menggunakan secara percuma, ingat bahawa penerbitan semula kod ini tertakluk kepada Peraturan Dalaman.
Coming Soon: ChrisMoodyTrading.com
Penafian
Maklumat dan penerbitan adalah tidak bertujuan, dan tidak membentuk, nasihat atau cadangan kewangan, pelaburan, dagangan atau jenis lain yang diberikan atau disahkan oleh TradingView. Baca lebih dalam Terma Penggunaan.