OPEN-SOURCE SCRIPT
Telah dikemas kini Visual RSI
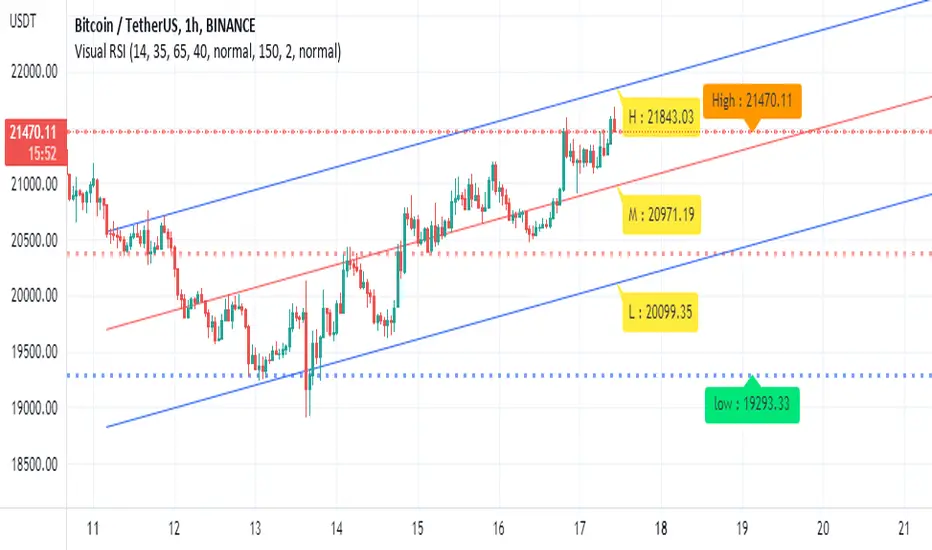
This is a visual format of regular RSI on the screen.
The indicator give you the RSI level for the high and lows and average as well. So it very easy to use it as you normally do with any RSI
buy point are when price reach bellow lower level and start breaking up. sell vice versa
it a concept idea to make our regular RSI more effective for the common user
I hope you like it
1 min chart

15min

The indicator give you the RSI level for the high and lows and average as well. So it very easy to use it as you normally do with any RSI
buy point are when price reach bellow lower level and start breaking up. sell vice versa
it a concept idea to make our regular RSI more effective for the common user
I hope you like it
1 min chart
15min
Nota Keluaran
add linear regression to make analysis better Skrip sumber terbuka
Dalam semangat TradingView sebenar, pencipta skrip ini telah menjadikannya sumber terbuka, jadi pedagang boleh menilai dan mengesahkan kefungsiannya. Terima kasih kepada penulis! Walaupuan anda boleh menggunakan secara percuma, ingat bahawa penerbitan semula kod ini tertakluk kepada Peraturan Dalaman.
Penafian
Maklumat dan penerbitan adalah tidak bertujuan, dan tidak membentuk, nasihat atau cadangan kewangan, pelaburan, dagangan atau jenis lain yang diberikan atau disahkan oleh TradingView. Baca lebih dalam Terma Penggunaan.
Skrip sumber terbuka
Dalam semangat TradingView sebenar, pencipta skrip ini telah menjadikannya sumber terbuka, jadi pedagang boleh menilai dan mengesahkan kefungsiannya. Terima kasih kepada penulis! Walaupuan anda boleh menggunakan secara percuma, ingat bahawa penerbitan semula kod ini tertakluk kepada Peraturan Dalaman.
Penafian
Maklumat dan penerbitan adalah tidak bertujuan, dan tidak membentuk, nasihat atau cadangan kewangan, pelaburan, dagangan atau jenis lain yang diberikan atau disahkan oleh TradingView. Baca lebih dalam Terma Penggunaan.