PROTECTED SOURCE SCRIPT
Telah dikemas kini VVV Divergencia
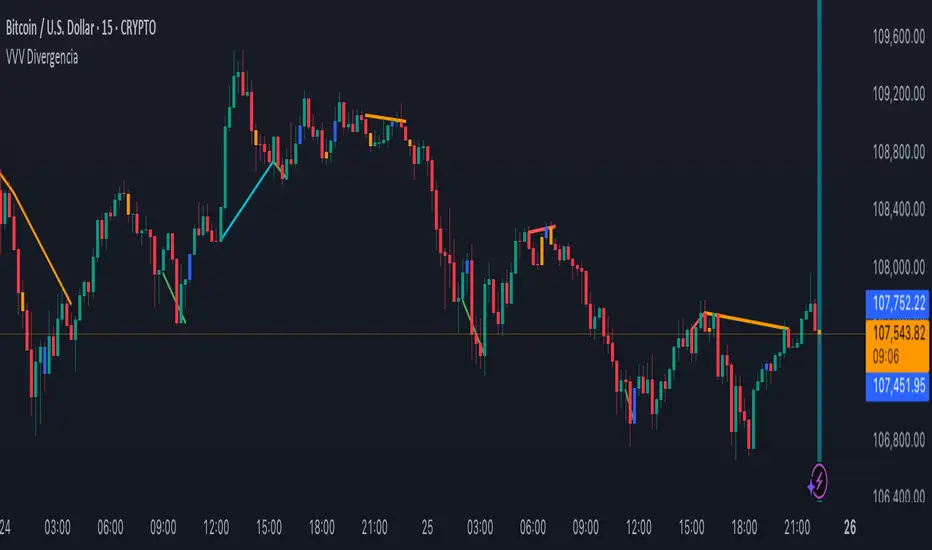
The **VVV Divergencia** indicator identifies bullish and bearish divergences on the chart by analyzing price action and fractal patterns. Here's a summary of its functions:
**Divergence Detection**: The indicator identifies regular and hidden divergences:
- **Bullish Divergence**: Occurs when the price forms a lower low while the oscillator makes a higher low, indicating potential upward momentum.
- **Bearish Divergence**: Occurs when the price forms a higher high while the oscillator makes a lower high, suggesting possible downward momentum.
- **Hidden Divergences**: These occur when the price does not align with the oscillator's movement, signaling potential continuation of the trend.
**Visual Indicators**: The script visually highlights these divergences on the chart:
- Bullish and bearish divergences are drawn as lines with different colors.
- The background color of the bars is changed based on the divergence signal, where green and orange indicate bullish patterns and red and aqua indicate bearish patterns.
**Customizable Parameters**: Users can adjust the source of the price data BASED ON ANY indicator.
This indicator is useful for traders looking to spot divergence patterns, which are often used to predict potential reversals or continuations in price trends.
A **VVV Divergencia** indikátor a divergenciák felismerésére szolgál a grafikonon.
**Divergenciák Felismerése**: Az indikátor a normál és rejtett divergenciákat is felismeri:
- **Bika Divergencia (Bullish Divergence)**: Akkor fordul elő, amikor az ár alacsonyabb mélypontot képez, miközben az oszcillátor magasabb mélypontot formál, ami emelkedésre utalhat.
- **Medve Divergencia (Bearish Divergence)**: Akkor jelenik meg, amikor az ár magasabb csúcsot ér el, miközben az oszcillátor alacsonyabb csúcsot mutat, ami csökkenésre utalhat.
- **Rejtett Divergenciák**: Ezek akkor fordulnak elő, amikor az ár nem igazodik az oszcillátor mozgásához, ami a trend folytatódására utalhat.
**Vizualizálás**: Az indikátor vizuálisan kiemeli a divergenciákat a grafikonon:
- A bullish és bearish divergenciák különböző színekkel vonalakként jelennek meg.
- A gyertyák háttérszíne is változik a divergenciák jelei alapján: a zöld és a türkiz bullish mintát, míg a piros és a narancssárga bearish mintát jelez.
**Testreszabható Paraméterek**: A felhasználók beállíthatják az árforrást ami bármilyen indikátorra beállítható.
Ez az indikátor hasznos lehet azoknak a tradereknek, akik a divergenciák alapján szeretnének előrejelzéseket készíteni, mivel ezek a minták gyakran előre jelzik az árfolyam fordulatait vagy a trendek folytatódását.
Nota Keluaran
Alertek hozzáadva!Skrip dilindungi
Skrip ini diterbitkan sebagai sumber tertutup. Akan tetapi, anda boleh menggunakannya secara bebas dan tanpa apa-apa had – ketahui lebih di sini.
Martin Hamza
vvvdestroyer.com/
vvvdestroyer.com/
Penafian
Maklumat dan penerbitan adalah tidak bertujuan, dan tidak membentuk, nasihat atau cadangan kewangan, pelaburan, dagangan atau jenis lain yang diberikan atau disahkan oleh TradingView. Baca lebih dalam Terma Penggunaan.
Skrip dilindungi
Skrip ini diterbitkan sebagai sumber tertutup. Akan tetapi, anda boleh menggunakannya secara bebas dan tanpa apa-apa had – ketahui lebih di sini.
Martin Hamza
vvvdestroyer.com/
vvvdestroyer.com/
Penafian
Maklumat dan penerbitan adalah tidak bertujuan, dan tidak membentuk, nasihat atau cadangan kewangan, pelaburan, dagangan atau jenis lain yang diberikan atau disahkan oleh TradingView. Baca lebih dalam Terma Penggunaan.