OPEN-SOURCE SCRIPT
Pappabborgia Nasdaq RSI
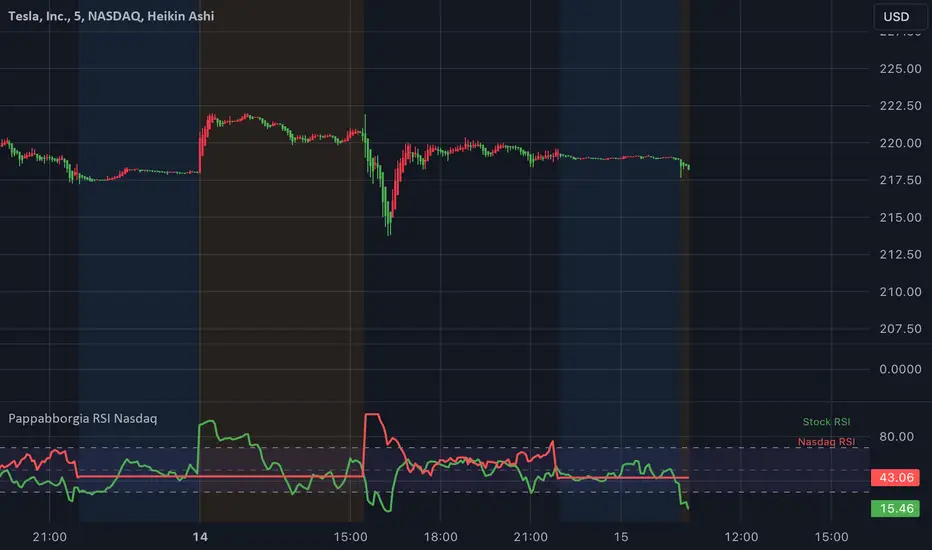
This script provides a custom Relative Strength Index (RSI) indicator that plots both the RSI of the selected stock and the Nasdaq (IXIC) on the same chart.
It offers a clear, side-by-side view to help traders better understand the stock's momentum relative to the overall market.
Key Features:
RSI Calculation for the Stock:
The script calculates the RSI for the chosen stock, with a default period of 14, adjustable to fit different timeframes.
The stock’s RSI is displayed in green 🟢, providing a direct view of its strength and momentum 📈.
RSI of the Nasdaq:
The script fetches the Nasdaq’s closing prices and calculates its RSI, which is shown in red for clear comparison 🔴.
Legend for Clarity:
A simple legend in the top-right corner identifies the green line as the stock’s RSI and the red line as the Nasdaq’s RSI, making it easy to interpret 📊.
Why Comparing the Stock's RSI to the Nasdaq Matters:
Broader Market Context:
Viewing both RSIs on the same chart helps you see whether the stock is moving in sync with the broader market or behaving independently. This provides valuable context for decision-making 📉.
Relative Strength Insights:
Comparing the stock’s RSI to the Nasdaq’s RSI highlights whether the stock is outperforming or underperforming the overall market, helping identify potential opportunities or risks 🟢🔴.
Improved Risk Management:
Monitoring overbought or oversold conditions in both the stock and Nasdaq RSIs can signal broader market trends and help avoid risky trades ⚠️.
Overall Benefit:
By tracking the RSI of both the stock and the Nasdaq, this script offers a powerful tool for understanding a stock's relative strength, providing essential context for smarter trading decisions 🎯.
Skrip sumber terbuka
Dalam semangat TradingView sebenar, pencipta skrip ini telah menjadikannya sumber terbuka, jadi pedagang boleh menilai dan mengesahkan kefungsiannya. Terima kasih kepada penulis! Walaupuan anda boleh menggunakan secara percuma, ingat bahawa penerbitan semula kod ini tertakluk kepada Peraturan Dalaman.
Penafian
Maklumat dan penerbitan adalah tidak bertujuan, dan tidak membentuk, nasihat atau cadangan kewangan, pelaburan, dagangan atau jenis lain yang diberikan atau disahkan oleh TradingView. Baca lebih dalam Terma Penggunaan.