OPEN-SOURCE SCRIPT
Telah dikemas kini Seri Indicator 0.1
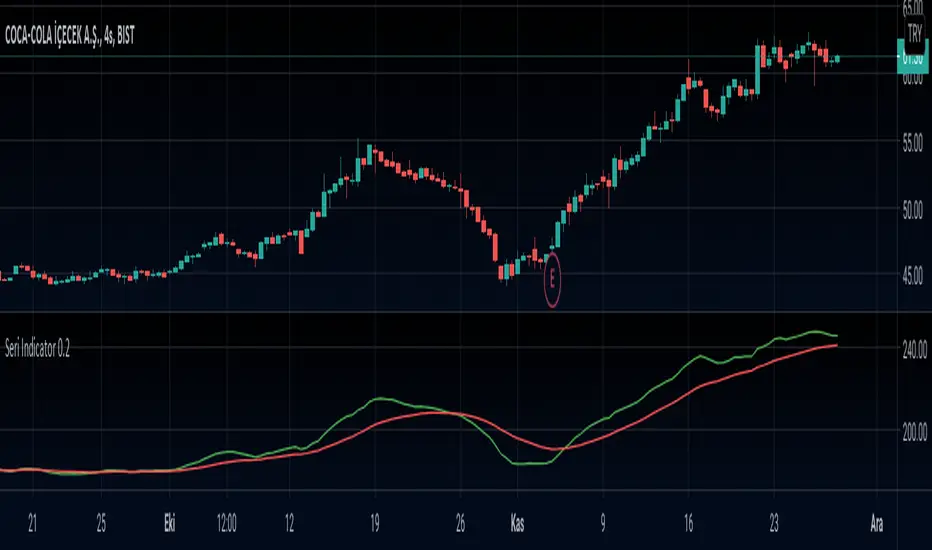
This is a Moving Average based indicator that is inspired by the MACD indicator. The indicator is intended to indicate trend reversals, and works best in hourly charts (1h-2h-3h-4h).
The Seri Indicator is easy to interpret, which was one of the design goals. If the Fast Moving Average (Green Line) crosses ABOVE the Slow Moving Average (Red Line), it indicates a BULLISH Trend, therefore a BUY SIGNAL. If the Fast Moving Average (Green Line) crosses BELOW the Slow Moving Average (Red Line), it indicates a BEARISH trend, therefore a SELL SIGNAL. The indicator is in development phase so it is natural for it to give faulty signals, so it is good practice to use it on a longer-term chart than the intended one (Use 2h chart for hourly trades etc.).
Any suggestions for improvements are highly welcome!
Nota Keluaran
This is a Moving Average based indicator that is inspired by the MACD indicator. The indicator is intended to indicate trend reversals, and works best in hourly charts (1h-2h-3h-4h).The Seri Indicator is easy to interpret, which was one of the design goals. If the Fast Moving Average (Green Line) crosses ABOVE the Slow Moving Average (Red Line), it indicates a BULLISH Trend, therefore a BUY SIGNAL. If the Fast Moving Average (Green Line) crosses BELOW the Slow Moving Average (Red Line), it indicates a BEARISH trend, therefore a SELL SIGNAL. The indicator is in development phase so it is natural for it to give faulty signals, so it is good practice to use it on a longer-term chart than the intended one (Use 2h chart for hourly trades etc.).
The current version is 0.2. The indicator is still in alpha/testing phase therefore is not market-ready for big amounts of investment.
Any suggestions for improvements are highly welcome!
Skrip sumber terbuka
Dalam semangat TradingView sebenar, pencipta skrip ini telah menjadikannya sumber terbuka, jadi pedagang boleh menilai dan mengesahkan kefungsiannya. Terima kasih kepada penulis! Walaupuan anda boleh menggunakan secara percuma, ingat bahawa penerbitan semula kod ini tertakluk kepada Peraturan Dalaman.
Penafian
Maklumat dan penerbitan adalah tidak bertujuan, dan tidak membentuk, nasihat atau cadangan kewangan, pelaburan, dagangan atau jenis lain yang diberikan atau disahkan oleh TradingView. Baca lebih dalam Terma Penggunaan.