OPEN-SOURCE SCRIPT
Catastrophe Distance
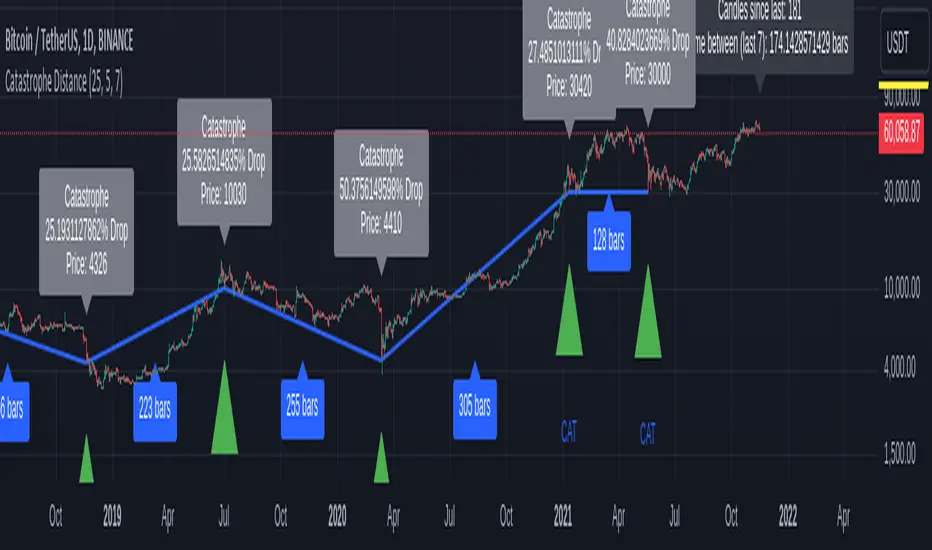
Catastrophe Distance is a tool to visually explore the time between catastrophic price moves.
Catastrophes are defined with 2 variables:
drawdown_threshold: the amount of percent the price has to fall
lookback_period = the amount of last candles in which drawdown_threshold was reached.
Drawdown_threshold per default is 25% and lookback_period is 5, meaning per default if price moves -25% in the last 5 candles you have a catastrophe.
Feel free to play around with this values to fit all the events you consider a catastrophe.
This indicator does not provide signals. It however implies caution if the time since the last catastrophe is higher then the average time between catastrophes (of last x catastrophes).
This is marked by the label over the current price showing the actual and average time since last catastrophe turning from green to black.
Given that the distance between catastrophes is somewhat cyclical:
Maybe now is a good time to start phishing for low limit orders and reduce leverage?
Skrip sumber terbuka
Dalam semangat TradingView sebenar, pencipta skrip ini telah menjadikannya sumber terbuka, jadi pedagang boleh menilai dan mengesahkan kefungsiannya. Terima kasih kepada penulis! Walaupuan anda boleh menggunakan secara percuma, ingat bahawa penerbitan semula kod ini tertakluk kepada Peraturan Dalaman.
Penafian
Maklumat dan penerbitan adalah tidak bertujuan, dan tidak membentuk, nasihat atau cadangan kewangan, pelaburan, dagangan atau jenis lain yang diberikan atau disahkan oleh TradingView. Baca lebih dalam Terma Penggunaan.