OPEN-SOURCE SCRIPT
Telah dikemas kini Faust
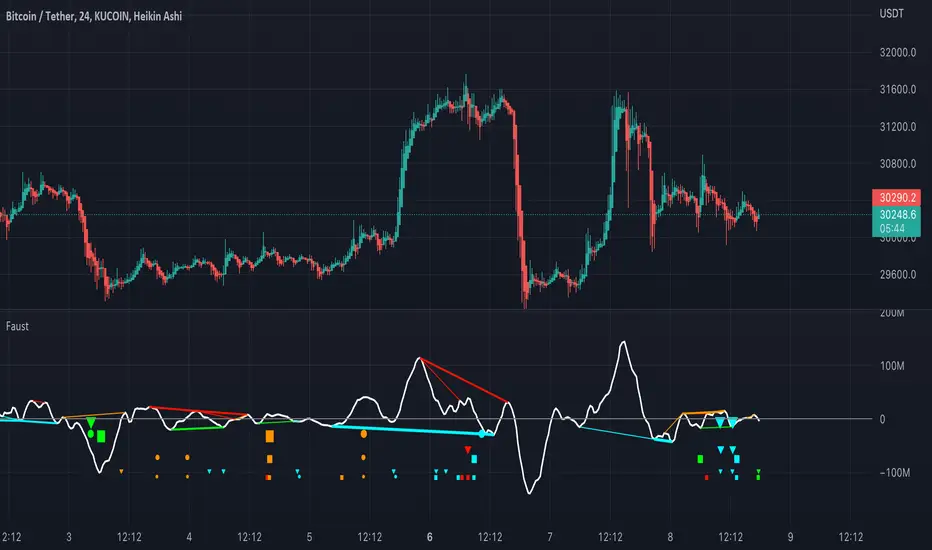
Faust is a composite indicator that combines 3 volume indicators: TSV, OBV, and PVT.
TSV moving average is plotted as an oscillator. OBV and PVT are calculated internally.
Four divergences are calculated for each indicator (regular bearish, regular bullish, hidden bearish, and hidden bullish) with three look-back periods (high, mid, and small).
For TSV, the fattest plotted line is the divergence with the highest look-back period, and the thinnest line is the divergence with the shortest look-back period.
For PVT, the larger the circle, the higher the divergence look-back period.
For OBV, the larger the triangle, the higher the divergence look-back period.
Nota Keluaran
Add CVD divs, fix colors.Nota Keluaran
Add TSV Oscillator ModeNota Keluaran
- Implemented a different method to draw divs for TSV to reduce the number of outputs on the chart and make space for the hidden div alerts.
- Added alerts for hidden divs
- Refactored inputs
Nota Keluaran
Fix the source bugNota Keluaran
Make hlc3 a default sourceSkrip sumber terbuka
Dalam semangat TradingView sebenar, pencipta skrip ini telah menjadikannya sumber terbuka, jadi pedagang boleh menilai dan mengesahkan kefungsiannya. Terima kasih kepada penulis! Walaupuan anda boleh menggunakan secara percuma, ingat bahawa penerbitan semula kod ini tertakluk kepada Peraturan Dalaman.
Penafian
Maklumat dan penerbitan adalah tidak bertujuan, dan tidak membentuk, nasihat atau cadangan kewangan, pelaburan, dagangan atau jenis lain yang diberikan atau disahkan oleh TradingView. Baca lebih dalam Terma Penggunaan.
Skrip sumber terbuka
Dalam semangat TradingView sebenar, pencipta skrip ini telah menjadikannya sumber terbuka, jadi pedagang boleh menilai dan mengesahkan kefungsiannya. Terima kasih kepada penulis! Walaupuan anda boleh menggunakan secara percuma, ingat bahawa penerbitan semula kod ini tertakluk kepada Peraturan Dalaman.
Penafian
Maklumat dan penerbitan adalah tidak bertujuan, dan tidak membentuk, nasihat atau cadangan kewangan, pelaburan, dagangan atau jenis lain yang diberikan atau disahkan oleh TradingView. Baca lebih dalam Terma Penggunaan.