OPEN-SOURCE SCRIPT
Adjustable Correction from ATH Signal
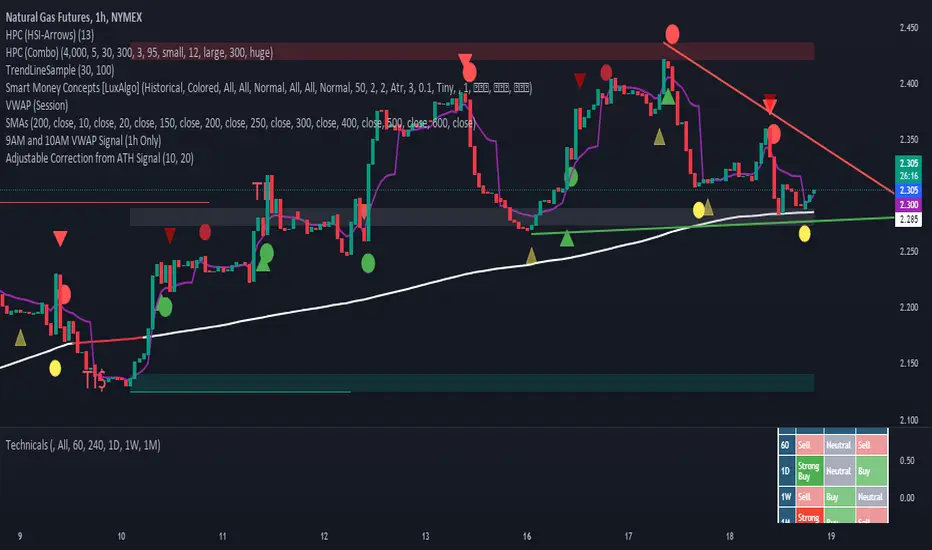
A "Correction Signal from All-Time High" is an indicator used to identify potential reversals or pullbacks in an asset's price after it has reached its highest historical level, known as an all-time high (ATH). This signal typically occurs when the price begins to decline after hitting the ATH, suggesting a correction phase where the asset retraces part of its upward movement.
Key elements of this signal include:
Overbought Conditions: The asset may have experienced a strong rally leading to an overbought condition, where the price could be considered too high relative to recent trends.
Reversal Patterns: The correction signal is often accompanied by technical patterns or indicators that suggest a reversal, such as bearish candlestick formations, negative divergence in momentum indicators, or moving average crossovers.
Percentage Decline: A correction is generally defined as a price drop of at least 10% from the ATH, although smaller pullbacks may also signal potential market shifts.
Volume Analysis: Increased selling volume after the ATH can validate the correction signal, indicating that more market participants are taking profits or exiting positions.
This signal helps traders and investors anticipate periods of market consolidation or potential downturns after significant price advances, allowing for better risk management or entry points for new positions.
Skrip sumber terbuka
Dalam semangat TradingView sebenar, pencipta skrip ini telah menjadikannya sumber terbuka, jadi pedagang boleh menilai dan mengesahkan kefungsiannya. Terima kasih kepada penulis! Walaupuan anda boleh menggunakan secara percuma, ingat bahawa penerbitan semula kod ini tertakluk kepada Peraturan Dalaman.
Penafian
Maklumat dan penerbitan adalah tidak bertujuan, dan tidak membentuk, nasihat atau cadangan kewangan, pelaburan, dagangan atau jenis lain yang diberikan atau disahkan oleh TradingView. Baca lebih dalam Terma Penggunaan.