PROTECTED SOURCE SCRIPT
TS & AO
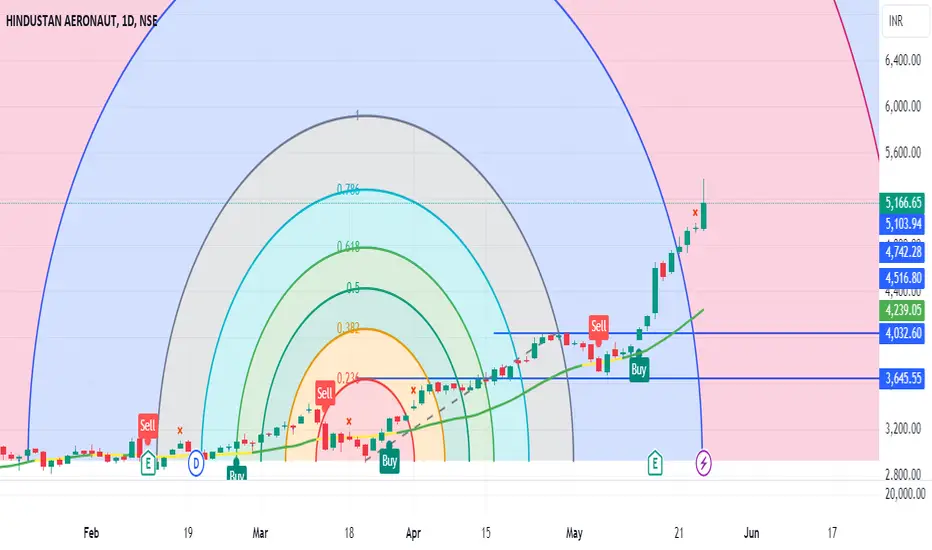
This is Best Intraday and Swing Trading Indicator
Certainly! Let’s explore some intraday and swing trading indicators that can help traders make informed decisions
SuperTrend:
The Supertrend indicator is commonly used for intraday trading.
It is plotted on the price chart and helps determine the current trend.
Parameters: It uses the Average True Range (ATR) with default values of 10 for the period and 3 for the multiplier.
Interpretation:
Upward trend: When Supertrend is below the bars and changes color to green, it indicates a buy signal.
Downward trend: When Supertrend is above the bars and turns red, it signals a sell opportunity1.
VWAP (Volume Weighted Average Price):
VWAP is a volume-based indicator.
It compares the value of a stock traded at a specific time to the total volume traded for that stock.
Interpretation:
Bullish trend: When the stock price is above VWAP, it suggests an uptrend.
Traders can consider buying on retracements toward VWAP in the direction of the trend1.
Moving Averages (MAs):
MAs are versatile indicators suitable for intraday, swing, and longer-term trading.
Common MAs include:
9-day MA: Short-term trend indicator.
50-day MA: Intermediate trend indicator.
100-day MA: Longer-term trend indicator.
Interpretation:
Uptrend: When the stock price is above the MA, it signals a bullish trend.
Downtrend: When the price is below the MA, it suggests a bearish trend2.
Skrip dilindungi
Skrip ini diterbitkan sebagai sumber tertutup. Akan tetapi, anda boleh menggunakannya secara bebas dan tanpa apa-apa had – ketahui lebih di sini.
Penafian
Maklumat dan penerbitan adalah tidak bertujuan, dan tidak membentuk, nasihat atau cadangan kewangan, pelaburan, dagangan atau jenis lain yang diberikan atau disahkan oleh TradingView. Baca lebih dalam Terma Penggunaan.