OPEN-SOURCE SCRIPT
BTC Slayer 9000 - Relative Risk-adjusted performance
BTC Slayer 9000: Relative Risk-Adjusted Performance
Dear friends and fellow traders,
I am pleased to introduce the BTC Slayer 9000, a script designed to provide clear insights into risk-adjusted performance relative to a benchmark. Whether you're navigating the volatile world of cryptocurrencies or exploring opportunities in stocks, this tool helps you make informed decisions by comparing assets against your chosen benchmark.
What Does It Do?
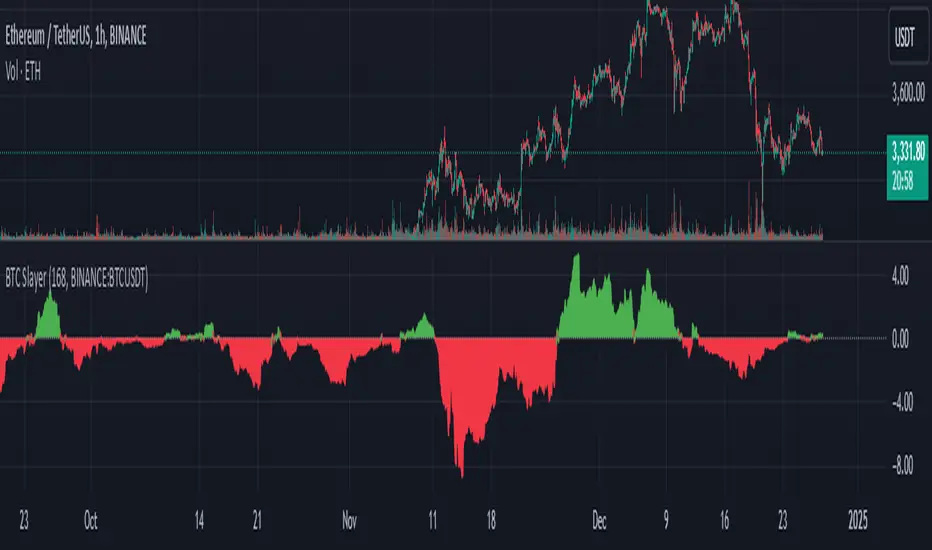
This indicator is based on the Ulcer Index (UI), a metric that measures downside risk. It calculates the Ulcer Performance Index (UPI), which combines returns and downside risk, and compares it to a benchmark (like BTC/USDT, SPY500, or any trading pair).
The result is the Relative UPI (RUPI):
Positive RUPI (green area): The asset's risk-adjusted performance is better than the benchmark.
Negative RUPI (red area): The asset's risk-adjusted performance is worse than the benchmark.
Why Use It?
Risk vs. Reward: See if the extra risk of an asset is justified by its returns.
Customizable Benchmark: Compare any asset against BTC, SPY500, or another chart.
Dynamic Insights: Quickly identify outperforming assets for long positions and underperformers for potential shorts.
How to Use:
Inputs:
Adjust the lookback period to set the time frame for analysis. 720 Period is meant to represent 30 days. I like to use 168 period because I do not hold trades for long.
Choose your comparison chart (e.g., BTC/USDT, SPY500, AAPL, etc.).
Interpretation:
Green Area Above 0: The asset offers better risk-adjusted returns than the benchmark.
Red Area Below 0: The benchmark is a safer or more rewarding option.
Perfect for All Traders
Whether you:
Trade Cryptocurrencies: Compare altcoins to BTC.
Invest in Stocks: Compare individual stocks to indices like SPY500.
Evaluate Portfolio Options: Decide between assets like AAPL or TSLA.
This indicator equips you with a systematic way to evaluate "Is the extra risk worth it?".
The script was compiled in Collaboration with ChatGPT
Dear friends and fellow traders,
I am pleased to introduce the BTC Slayer 9000, a script designed to provide clear insights into risk-adjusted performance relative to a benchmark. Whether you're navigating the volatile world of cryptocurrencies or exploring opportunities in stocks, this tool helps you make informed decisions by comparing assets against your chosen benchmark.
What Does It Do?
This indicator is based on the Ulcer Index (UI), a metric that measures downside risk. It calculates the Ulcer Performance Index (UPI), which combines returns and downside risk, and compares it to a benchmark (like BTC/USDT, SPY500, or any trading pair).
The result is the Relative UPI (RUPI):
Positive RUPI (green area): The asset's risk-adjusted performance is better than the benchmark.
Negative RUPI (red area): The asset's risk-adjusted performance is worse than the benchmark.
Why Use It?
Risk vs. Reward: See if the extra risk of an asset is justified by its returns.
Customizable Benchmark: Compare any asset against BTC, SPY500, or another chart.
Dynamic Insights: Quickly identify outperforming assets for long positions and underperformers for potential shorts.
How to Use:
Inputs:
Adjust the lookback period to set the time frame for analysis. 720 Period is meant to represent 30 days. I like to use 168 period because I do not hold trades for long.
Choose your comparison chart (e.g., BTC/USDT, SPY500, AAPL, etc.).
Interpretation:
Green Area Above 0: The asset offers better risk-adjusted returns than the benchmark.
Red Area Below 0: The benchmark is a safer or more rewarding option.
Perfect for All Traders
Whether you:
Trade Cryptocurrencies: Compare altcoins to BTC.
Invest in Stocks: Compare individual stocks to indices like SPY500.
Evaluate Portfolio Options: Decide between assets like AAPL or TSLA.
This indicator equips you with a systematic way to evaluate "Is the extra risk worth it?".
The script was compiled in Collaboration with ChatGPT
Skrip sumber terbuka
Dalam semangat TradingView sebenar, pencipta skrip ini telah menjadikannya sumber terbuka, jadi pedagang boleh menilai dan mengesahkan kefungsiannya. Terima kasih kepada penulis! Walaupuan anda boleh menggunakan secara percuma, ingat bahawa penerbitan semula kod ini tertakluk kepada Peraturan Dalaman.
Penafian
Maklumat dan penerbitan adalah tidak bertujuan, dan tidak membentuk, nasihat atau cadangan kewangan, pelaburan, dagangan atau jenis lain yang diberikan atau disahkan oleh TradingView. Baca lebih dalam Terma Penggunaan.