OPEN-SOURCE SCRIPT
Theoretical price by volume
This code is used to calculate a theoretical price range based on volume and price change and display it on the chart. Specifically, it calculates the “theoretical price volatility” based on price changes and volume, from which the upper and lower price limits are derived.
The price volatility is calculated by dividing the price change by the volume as the change unit volume.
Based on this volatility, we calculate the theoretical variation relative to the current price (“Theoretical Variance Difference”).
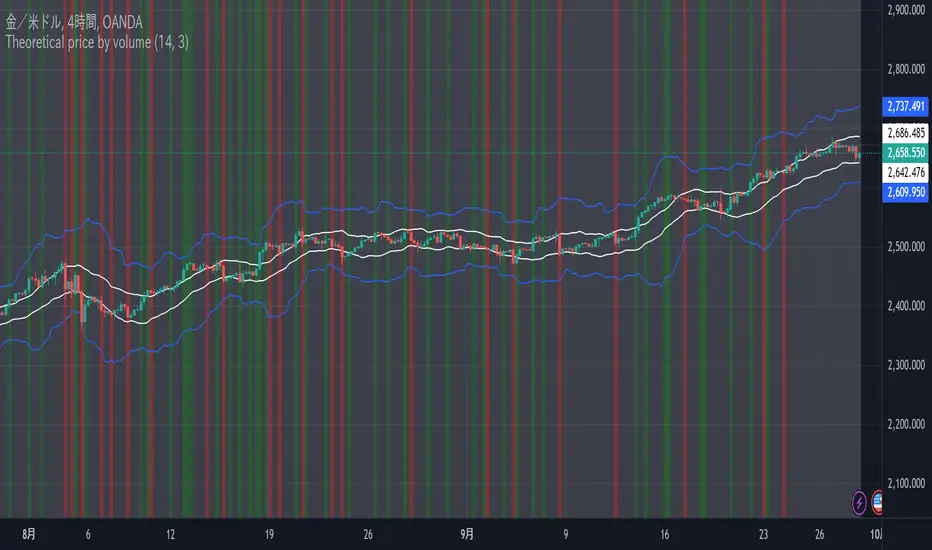
Based on the results, **Theoretical High Price (p_price) and Theoretical Low Price (m_price)** are calculated.
The chart displays the upper and lower bounds of these theoretical prices in color, and also calculates their mean and standard deviation (in the form of a Bollinger band) and plots them.
The background color on the chart indicates whether the price is within the theoretical price range, and at the same time, the mean and standard deviation of the theoretical prices are used to visualize price movements in more detail.
This indicator helps traders understand the impact of volume on price movements and helps them determine if prices are staying within the theoretical range or if there are unusual movements.
The price volatility is calculated by dividing the price change by the volume as the change unit volume.
Based on this volatility, we calculate the theoretical variation relative to the current price (“Theoretical Variance Difference”).
Based on the results, **Theoretical High Price (p_price) and Theoretical Low Price (m_price)** are calculated.
The chart displays the upper and lower bounds of these theoretical prices in color, and also calculates their mean and standard deviation (in the form of a Bollinger band) and plots them.
The background color on the chart indicates whether the price is within the theoretical price range, and at the same time, the mean and standard deviation of the theoretical prices are used to visualize price movements in more detail.
This indicator helps traders understand the impact of volume on price movements and helps them determine if prices are staying within the theoretical range or if there are unusual movements.
Skrip sumber terbuka
Dalam semangat TradingView sebenar, pencipta skrip ini telah menjadikannya sumber terbuka, jadi pedagang boleh menilai dan mengesahkan kefungsiannya. Terima kasih kepada penulis! Walaupuan anda boleh menggunakan secara percuma, ingat bahawa penerbitan semula kod ini tertakluk kepada Peraturan Dalaman.
Penafian
Maklumat dan penerbitan adalah tidak bertujuan, dan tidak membentuk, nasihat atau cadangan kewangan, pelaburan, dagangan atau jenis lain yang diberikan atau disahkan oleh TradingView. Baca lebih dalam Terma Penggunaan.